The price of oil has been volatile, and it has been tough to predict turning points. But I continue to rely on key trend lines that develop on the commodity as spots it is likely to hold at.
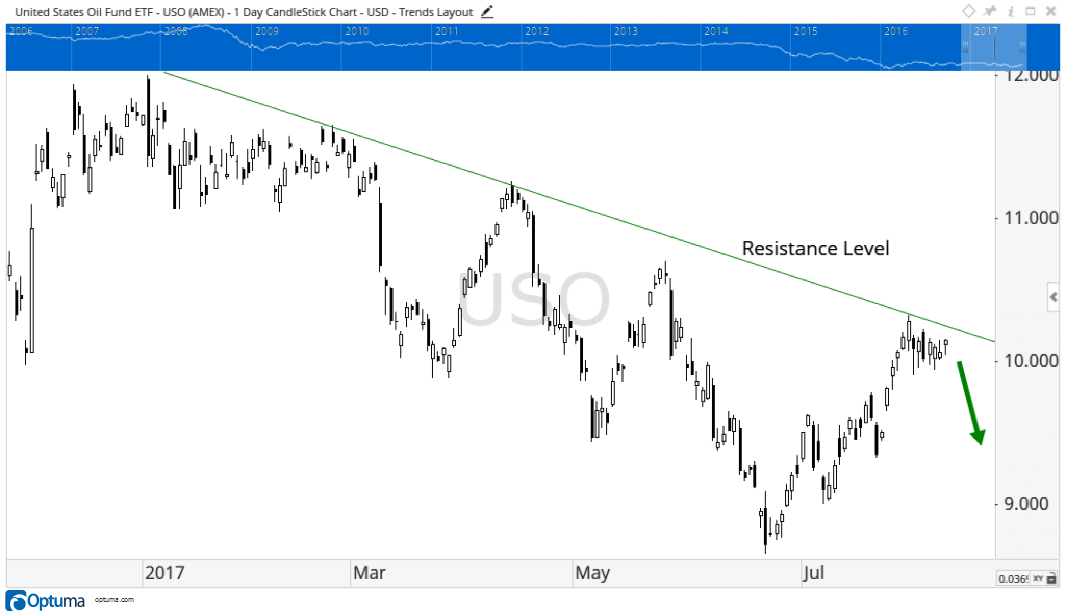
Currently, oil prices are testing a short-term resistance level. Take a look at this chart:

The chart shows a clear downward trend, testing that resistance level basically five times. (Even though one of those didn’t quite touch it, it was still a failed rally.)
Currently, prices are holding just below that resistance level.
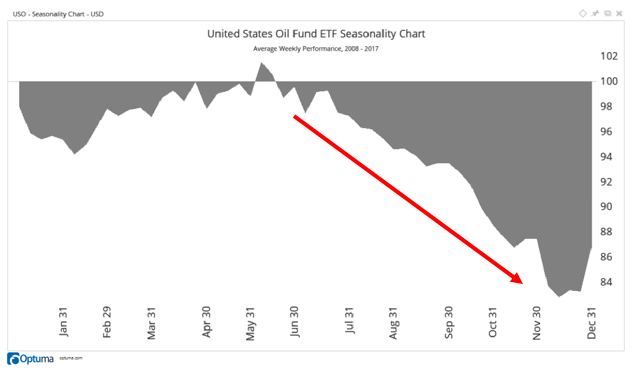
The reason I am tracking oil at the moment is because we recently entered the inverse oil prime season, which is a seasonal period where oil prices have seen pressure over the past decade.
Here’s a chart depicting that seasonal trend:

We are almost halfway through the month of August, and as you can tell, there is a clear downward trend in the seasonal pattern that is set to last until the end of the year.
That paves the way for a more than 10% decline in oil prices from now till the end of the year.
Regards,

Chad Shoop, CMT
Editor, Automatic Profits Alert


