Larry Fink is the CEO of asset manager BlackRock.
The firm isn’t a household name. But it’s the world’s largest asset manager, with $6 trillion under management.
Much of BlackRock’s work is behind the scenes. It provides trading platforms for large investors. Many of those investors also invest with BlackRock’s private equity funds and other investments.
Individuals can buy BlackRock’s iShares exchange-traded funds or mutual funds. Many institutions own these funds as well.
This all means BlackRock is in a unique position. Fink has access to information other analysts can’t see.
And right now, he sees a large amount of risk in stocks.
Recently, he told CNBC: “We have a risk of a melt-up, not a meltdown here.”
That might sound bullish. But it points to a market crash after the melt-up.
That’s because melt-ups are the most dangerous market conditions.
Fink Understands the Problem
Remember, Fink’s firm helps large managers invest. Right now, those managers have large cash reserves.
“Despite where the markets are in equities, we have not seen money being put to work,” Fink said. “We have record amounts of money in cash.”
That’s a problem because cash is a drag on performance. Large piles of cash earn 0% returns. With stocks surging, managers with cash holdings underperform.
Fink expects managers to put that cash to work. They do that by buying stocks.
A melt-up is a buying frenzy. Melt-ups are often bubbles. That’s the worst time to buy since crashes always follow bubbles.
It’s easy to see why melt-ups turn into meltdowns.
The Melt-Up Creates Instability
Buying pushes prices up. Buying by large managers, the kind Fink sees holding cash, leads to large gains.
For now, many large managers are lagging the market. So, they will buy the most aggressive stocks because they’re trying to make up for lost gains.
Then, when the market turns down, they know all their gains are at risk and they sell quickly.
This is, simply put, why we have crashes.
Large managers sell to avoid losses. Their selling pushes prices down, and other managers fear larger losses. They sell, and the cycle repeats until panic subsides.
This pattern played out in the last bear market.
Selling reached panic levels. It stopped in March 2009 as stocks rallied after the Federal Reserve announced plans to pump money into the economy.
After that, stocks melted up. The Dow Jones Industrial Average gained more than 35% in three months and more than 50% in the next year.
It was a rational melt-up. Earnings grew rapidly in 2009 as the economy emerged from a recession. So, a meltdown didn’t follow the rally.
This time is different.
Stocks are near all-time highs and earnings growth is slowing. Fundamentals indicate many stocks are overvalued.
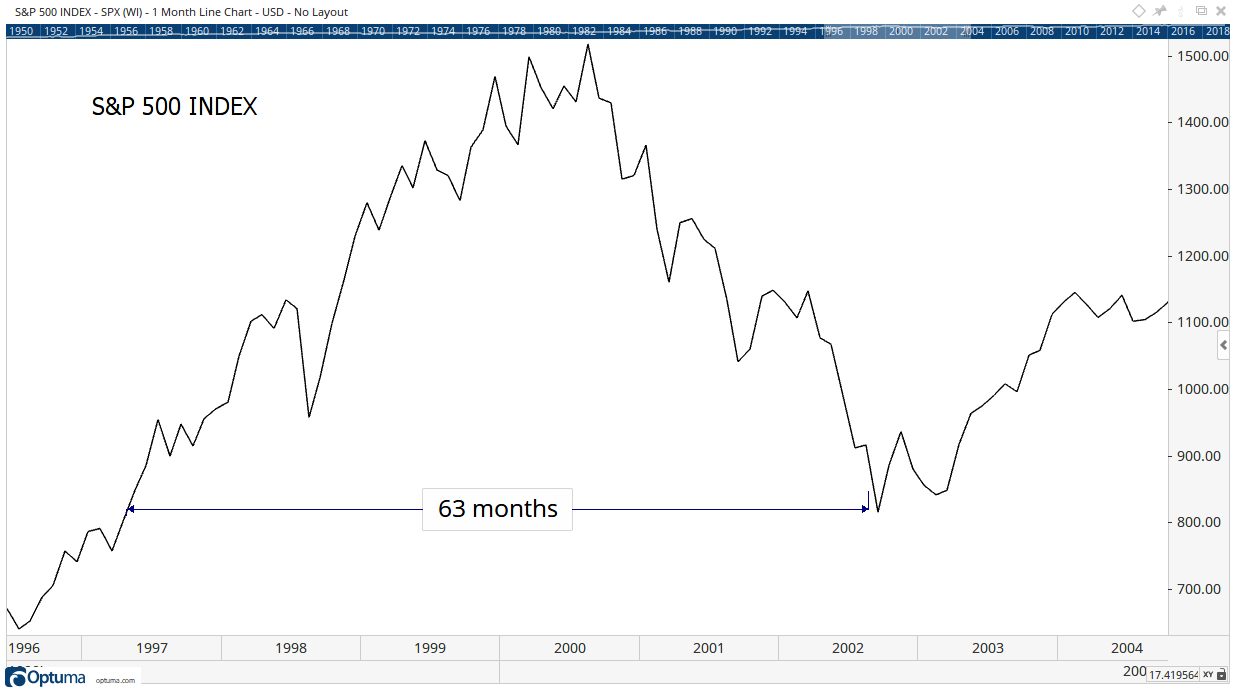
It’s the same setup we saw in the late 1990s when the internet bubble formed.
When that bubble crashed, investors lost more than five years’ worth of gains.

That was a FOMO melt-up. FOMO is the fear of missing out.
That’s what we’re likely to see this time. And it’s likely to end as bad as the one in 1999 did.
Defining Melt-Ups
Many analysts say a melt-up can’t be quantified.
As Supreme Court Justice Potter Stewart said in Jacobellis v. Ohio:
I shall not today attempt further to define the kinds of material I understand to be embraced within that shorthand description [“hardcore pornography”], and perhaps I could never succeed in intelligibly doing so. But I know it when I see it…
Rather than expecting to recognize a melt-up in the heat of the moment, we can quantify the idea.
We’ll use earnings to define a melt-up since stock prices track earnings growth in the long run. A melt-up is a time when that relationship breaks down.
To start, let’s test whether stock market total returns and earnings are related in the long run.
Since 1871, earnings grew an average of 9.1% per year. Total return, which includes dividends, grew an average of 10.5% a year over that time. There’s a high correlation over periods of at least 20 years.
Using earnings to define a melt-up recognizes that melt-ups like the one in 2009 are sometimes rational. When earnings are growing at a rapid pace, stock prices should also move at a rapid pace.
Rapid growth in earnings are periods when growth is unsustainable. Analysis shows that 90% of the time, earnings growth is between minus-37% and plus-37%.
Using that value as the cutoff, we can define melt-ups as periods of time when the trailing 12 months’ total return is greater than 37%.
So, we will know we are seeing a melt-up when the 12-month rate of change of the S&P 500 Index is at least 37%.
If Fink is right, that means the index would need to reach 3,700, more than 30% above recent prices. At that level, the price-to-earnings (P/E) ratio of the index would be at least 22, about 30% above its long-term average.
The P/E ratio is a tool that tells us if stocks are overvalued or undervalued. Higher-than-average P/E ratios usually occur when earnings growth is accelerating.
That’s not what we’re seeing now. Analysts expect earnings in 2019 to drop compared to 2018.
History shows that P/E ratios usually fall as earnings growth slows.
The Recession Is Coming Soon
A melt-up, if it occurs, isn’t justified by the fundamentals.
However, a recession is likely before 2020. And there just isn’t time for a melt-up before the economy turns down.
Fink’s comments highlight just how dangerous this market is.
What he was really saying was: “There are a lot of highly paid investment managers who missed this rally. They are about to make wild bets hoping to preserve their bonuses. When stocks turn down, they will sell frantically. Individuals should buckle up for a wild ride to nowhere.”
Rather than buying into a bull trap, a rally is a chance to become defensive.
Regards,

Michael Carr, CMT, CFTe
Editor, Peak Velocity Trader


