I have been studying the charts of gold for months now, and I believe it is on the cusp of a major breakout higher.
One that will send the price of gold roaring higher for what likely could be the next decade.
But in the short-term, gold prices are entering their bearish prime season, meaning it’s a time of the year the price typically heads lower.
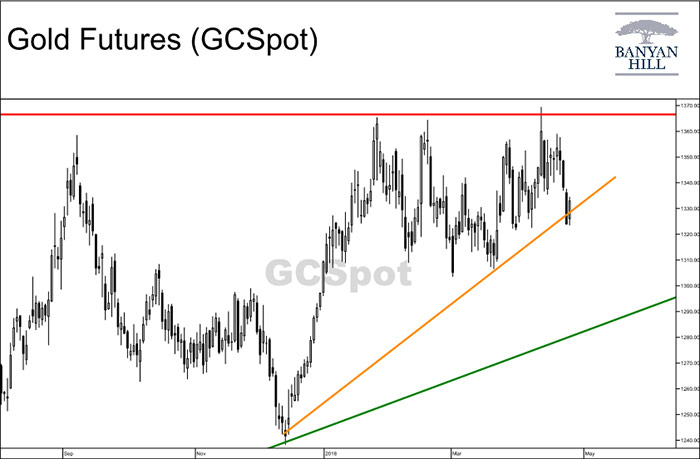
And when you look at a chart of gold prices, you’ll see how a short-term pullback is likely in the cards.

Understanding Trend Lines
The red and green trend lines depict the ascending triangle pattern that has formed. But the orange trend line highlights a support level that is set to be breached — which could send the gold price down to $1,270, or about a 4% move.
From there, as long as it holds above that green trend line, gold is still set to rally for years to come.
Just be sure you can ride out the short-term volatility we will see until it breaks out higher.
Regards,

Chad Shoop, CMT
Editor, Automatic Profits Alert


