Today, I have an important trade signal you need to hear about.
It’s important because almost every key bull market move is built on it. I believe the move it’s forecasting could be rapid and fierce.
At the same time, it’s one most traders are missing. Not due to negligence… Rather, they simply don’t have access to the data I do.
Today I’ll clue you in on what I’m seeing, and show you why most traders will likely be taken by surprise by this move…
A Powerful Breakout in Small Caps
The signal is in small cap stocks. Now, small-caps tend to be more speculative. Because of that, they offer important insight into trader psychology.
When aggressive traders are bullish, they buy small caps because they offer the biggest potential returns. When those traders are bearish, they tend to buy safer, large-cap stocks.
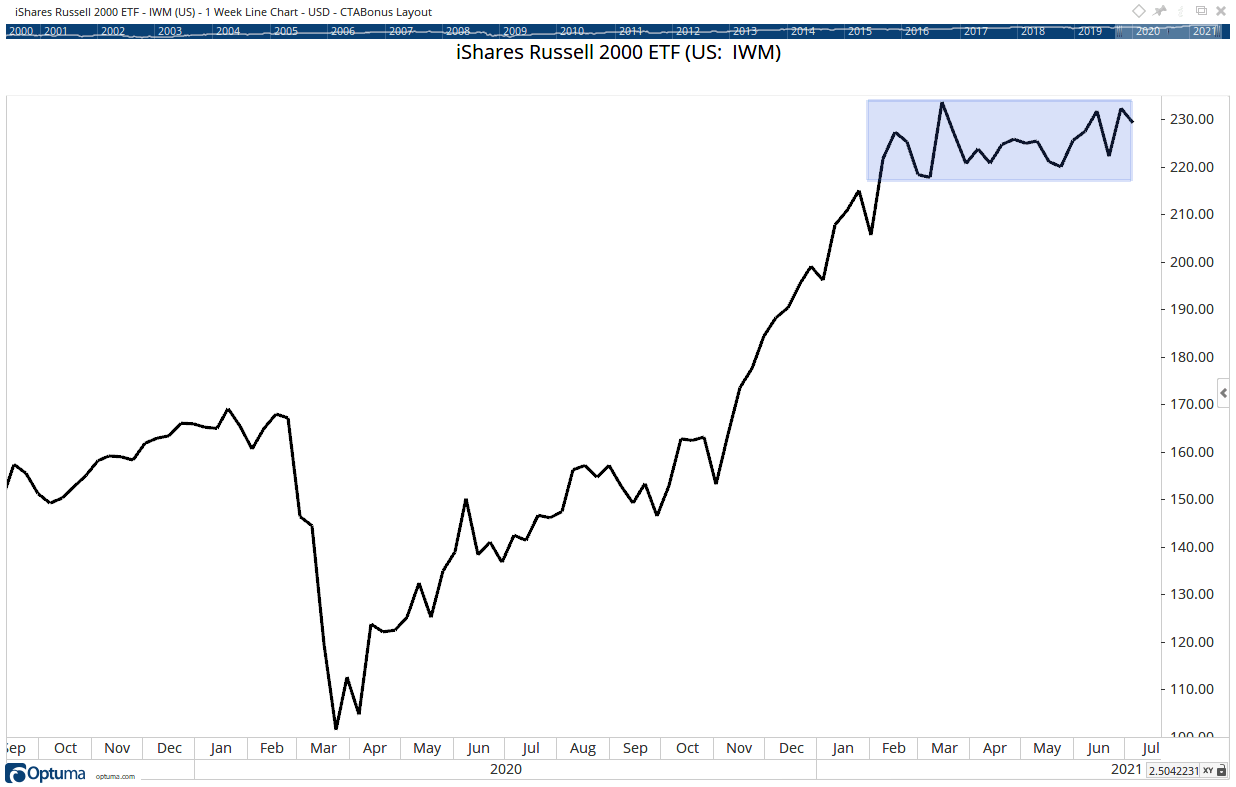
Small-cap stocks have been stuck in a trading range since February. At Friday’s close, the Russell 2000 Index, a popular small-cap benchmark, was at the same level it was at 20 weeks ago. It’s been chopping around between 2360 and 2134. Roughly a 10% range.
Just take a look at the chart below.
(Click here to view larger image.)
This is a chart of the iShares Russell 2000 ETF (NYSE: IWM), an exchange-traded fund (ETF) that tracks the Russell 2000. The trading range is highlighted in blue.
Price movement in a narrow range like we’ve seen in recent months is a sign of indecision. Traders aren’t sure whether to be bullish or bearish, so they avoid large positions.
But eventually, prices break out of the range — up or down. And the longer prices spend within a range, the more powerful the potential breakout will be.
Sounds exciting, right? There’s likely a big, tradable move coming in small-cap stocks.
Here’s the problem…
Where Most Traders Get Breakouts Wrong
To determine whether breakouts will be to the upside or downside, traders often turn to momentum indicators.
There’s a widespread belief that momentum leads price. When these momentum indicators offer signals, traders then expect the price action to move in that same direction.
To gauge momentum, traders may follow popular tools such as RSI or MACD. These indicators have drawbacks and are rarely used by trading desks at large hedge funds.
The issue is in their popularity. An indicator becomes far less effective the more that people use it. There’s no edge in using popular tools with the same old parameters.
So, trading professionals often create their own indicators. I’ve done just the same.
My indicator is designed to capture the same information the Volatility Index (VIX) does — the level of fear in the market.
But this indicator also addresses some of the problems with the VIX…
One problem is that it applies only to the S&P 500. While other indexes and many stocks often move in the same direction as the S&P 500, it’s best to use indicators that track the stock or ETF you’re trading.
The indicator I developed is based on the price action of each stock or ETF it’s applied to. That makes it a far more flexible and useful tool.
Another problem with the VIX is that it doesn’t offer signals in real time. In hindsight, it’s easy to spot bottoms with VIX. Bottoms occur when VIX is high, reflecting high levels of fear in the market.
I designed my indicator to provide clear buy or sell signals when it moves above or below zero.
What My Indicator Says About the Small-Cap Breakout
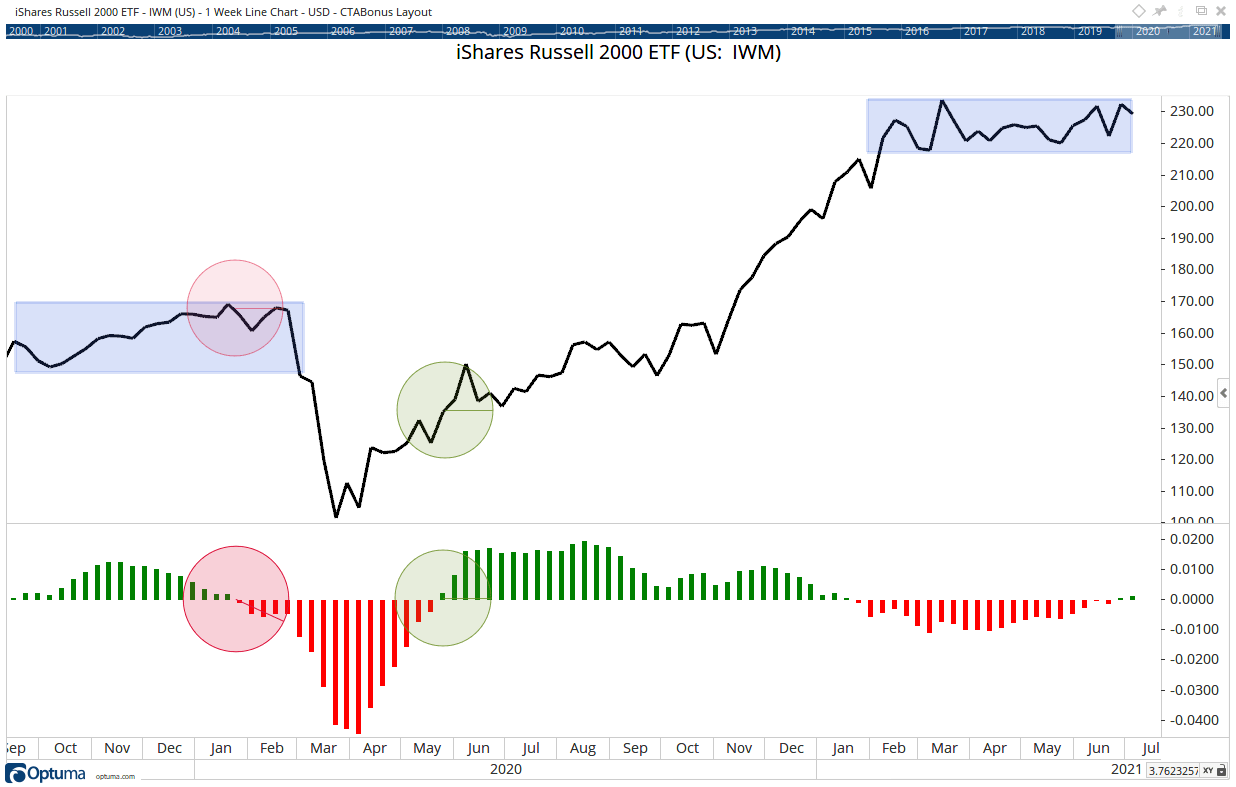
With this in mind, let’s take another look at the chart of IWM, this time with my indicator at the bottom…
(Click here to view larger image.)
Buy signals are shown in green on the chart. Red indicates a sell signal. The larger the bar, the more potent the buy signal.
This indicator correctly forecast the breakout of the last two trading ranges shown in the chart. In January 2020, it broke to the downside. Prices followed in a bear market that coincided with the pandemic.
Then, my indicator flashed a buy signal when IWM was still about 25% off its highs in May. And it stayed bullish for the next few months.
Last August, the bull market stalled. My indicator dipped but remained on a buy signal until shortly before the recent trading range developed.
Right now, this tool just flashed the first buy signal of the past six months — as IWM was stuck in its range. This is telling us that small caps could soon push to new all-time highs.
Buying call options on IWM, dated out a couple months, is a high-odds trade right now.
I’ll keep you updated on what’s happening with my indicator in future issues, and let you know of any good trade opportunities it presents.
Regards,

Michael J. Carr
Editor, Precision Profits
P.S. To get content like this in your inbox every day, subscribe to True Options Masters. Click here and subscribe.