
Lately, my two-year-old has become a little thrill seeker. She loves riding her scooter, especially downhill. This makes Mom uncomfortable (and sometimes Dad too).
But she’s starting to understand momentum — how she picks up speed going down that dip in the sidewalk.
Momentum is also a critical aspect to stock investing.
I touched on it back in October. During my Agora Uncensored interview with Garrett Baldwin, I talked about something called “market momentum.”

Market momentum is a metric that financial experts, economists and Wall Street traders follow. Certain stocks give signs that they’re positioned for growth (and profits) in the near future. As analysts, we follow these signs and invest accordingly.
These signs can be “fundamental,” or favorable financial numbers like earnings per share (EPS), price to earnings (P/E) and the compounded annual growth rate (CAGR). All of these metrics can shade in part of the picture.
Then there are more “technical” signs, like the stock’s price action. By looking a company’s historical revenue data, you compare what it earned in previous years vs. what it’s currently bringing in. Is it gradually (or exponentially) increasing?
If you combine the fundamental with the technical, that’s market momentum. And I want to know all I can about these metrics before investing.
In turn, those of you who are subscribed to my financial services get my hand-picked stock recommendations (plus alerts on when to buy and when to sell).
But what are these growth signs, and what are the actual moving parts of technical analytics?
I’ll go over all of this.
First, let’s get into a few key elements of stock analysis. Then I’ll lay out three major signs that a stock has market momentum.
Basic Elements of Stock Analysis

There’s a lot that goes into stock analysis.
You can get an entire MBA and still have a lot to learn about stock market analytics. But here are the terms you should know:
- Fundamental analysis:
Stocks represent businesses that have enough assets and growth to become publicly traded.
Fundamental analysis is all about a company’s financial data — its balance sheets, income and cash flow statements, expense reports, company assets, market share and other ratios (which we’ll get into next).
All of this can help us evaluate a company’s financial health, and ultimately determine its stock value.
- Earnings per share (EPS):
Earnings per share is a financial ratio. It determines a stock’s value by calculating the company’s profit earnings (net income) divided by outstanding shares. A higher EPS means a greater value on the stock.
Formula for EPS: Net profit / outstanding shares.
But you shouldn’t use the EPS metric alone to value a stock because it can be distorted (on purpose or not).
For example, a one-time supply shortage could have prevented a company’s normal quota of sales, making the EPS lower for that quarter. Or a company could intentionally manipulate its stock share price through share issuances, stock splits and/or stock buybacks, changing the way EPS is calculated.
- Price to earnings (P/E):
The price-to-earnings ratio is like a fresh cup of coffee: You don’t want it burning hot (too high), but you also don’t want it lukewarm (too low). A company’s P/E compares the stock share price to the EPS. So it’s another way to calculate the stock value.
Formula for P/E: Share price / Earnings per share
A high P/E could suggest a stock is overvalued, while a low P/E suggests the opposite. But a company that isn’t making money, of course, has no P/E at all.
- Price to earnings to growth (PEG):
This is usually compared along with the P/E ratio because it directly measures the earnings growth of a stock against its share price.
Formula for PEG: (Price / Earnings) / Growth rate
This metric tells us if a stock is accurately priced. Using PEG together with P/E and EPS gives a much clearer picture of a stock’s value.
- Compounded annual growth rate (CAGR):
The compounded annual growth rate measures the rate of return (ROR) on a company’s investments over a period of time. The CAGR then pinpoints how much an investment needs to grow from beginning balance of funds to its ending balance.
Formula for CAGR:
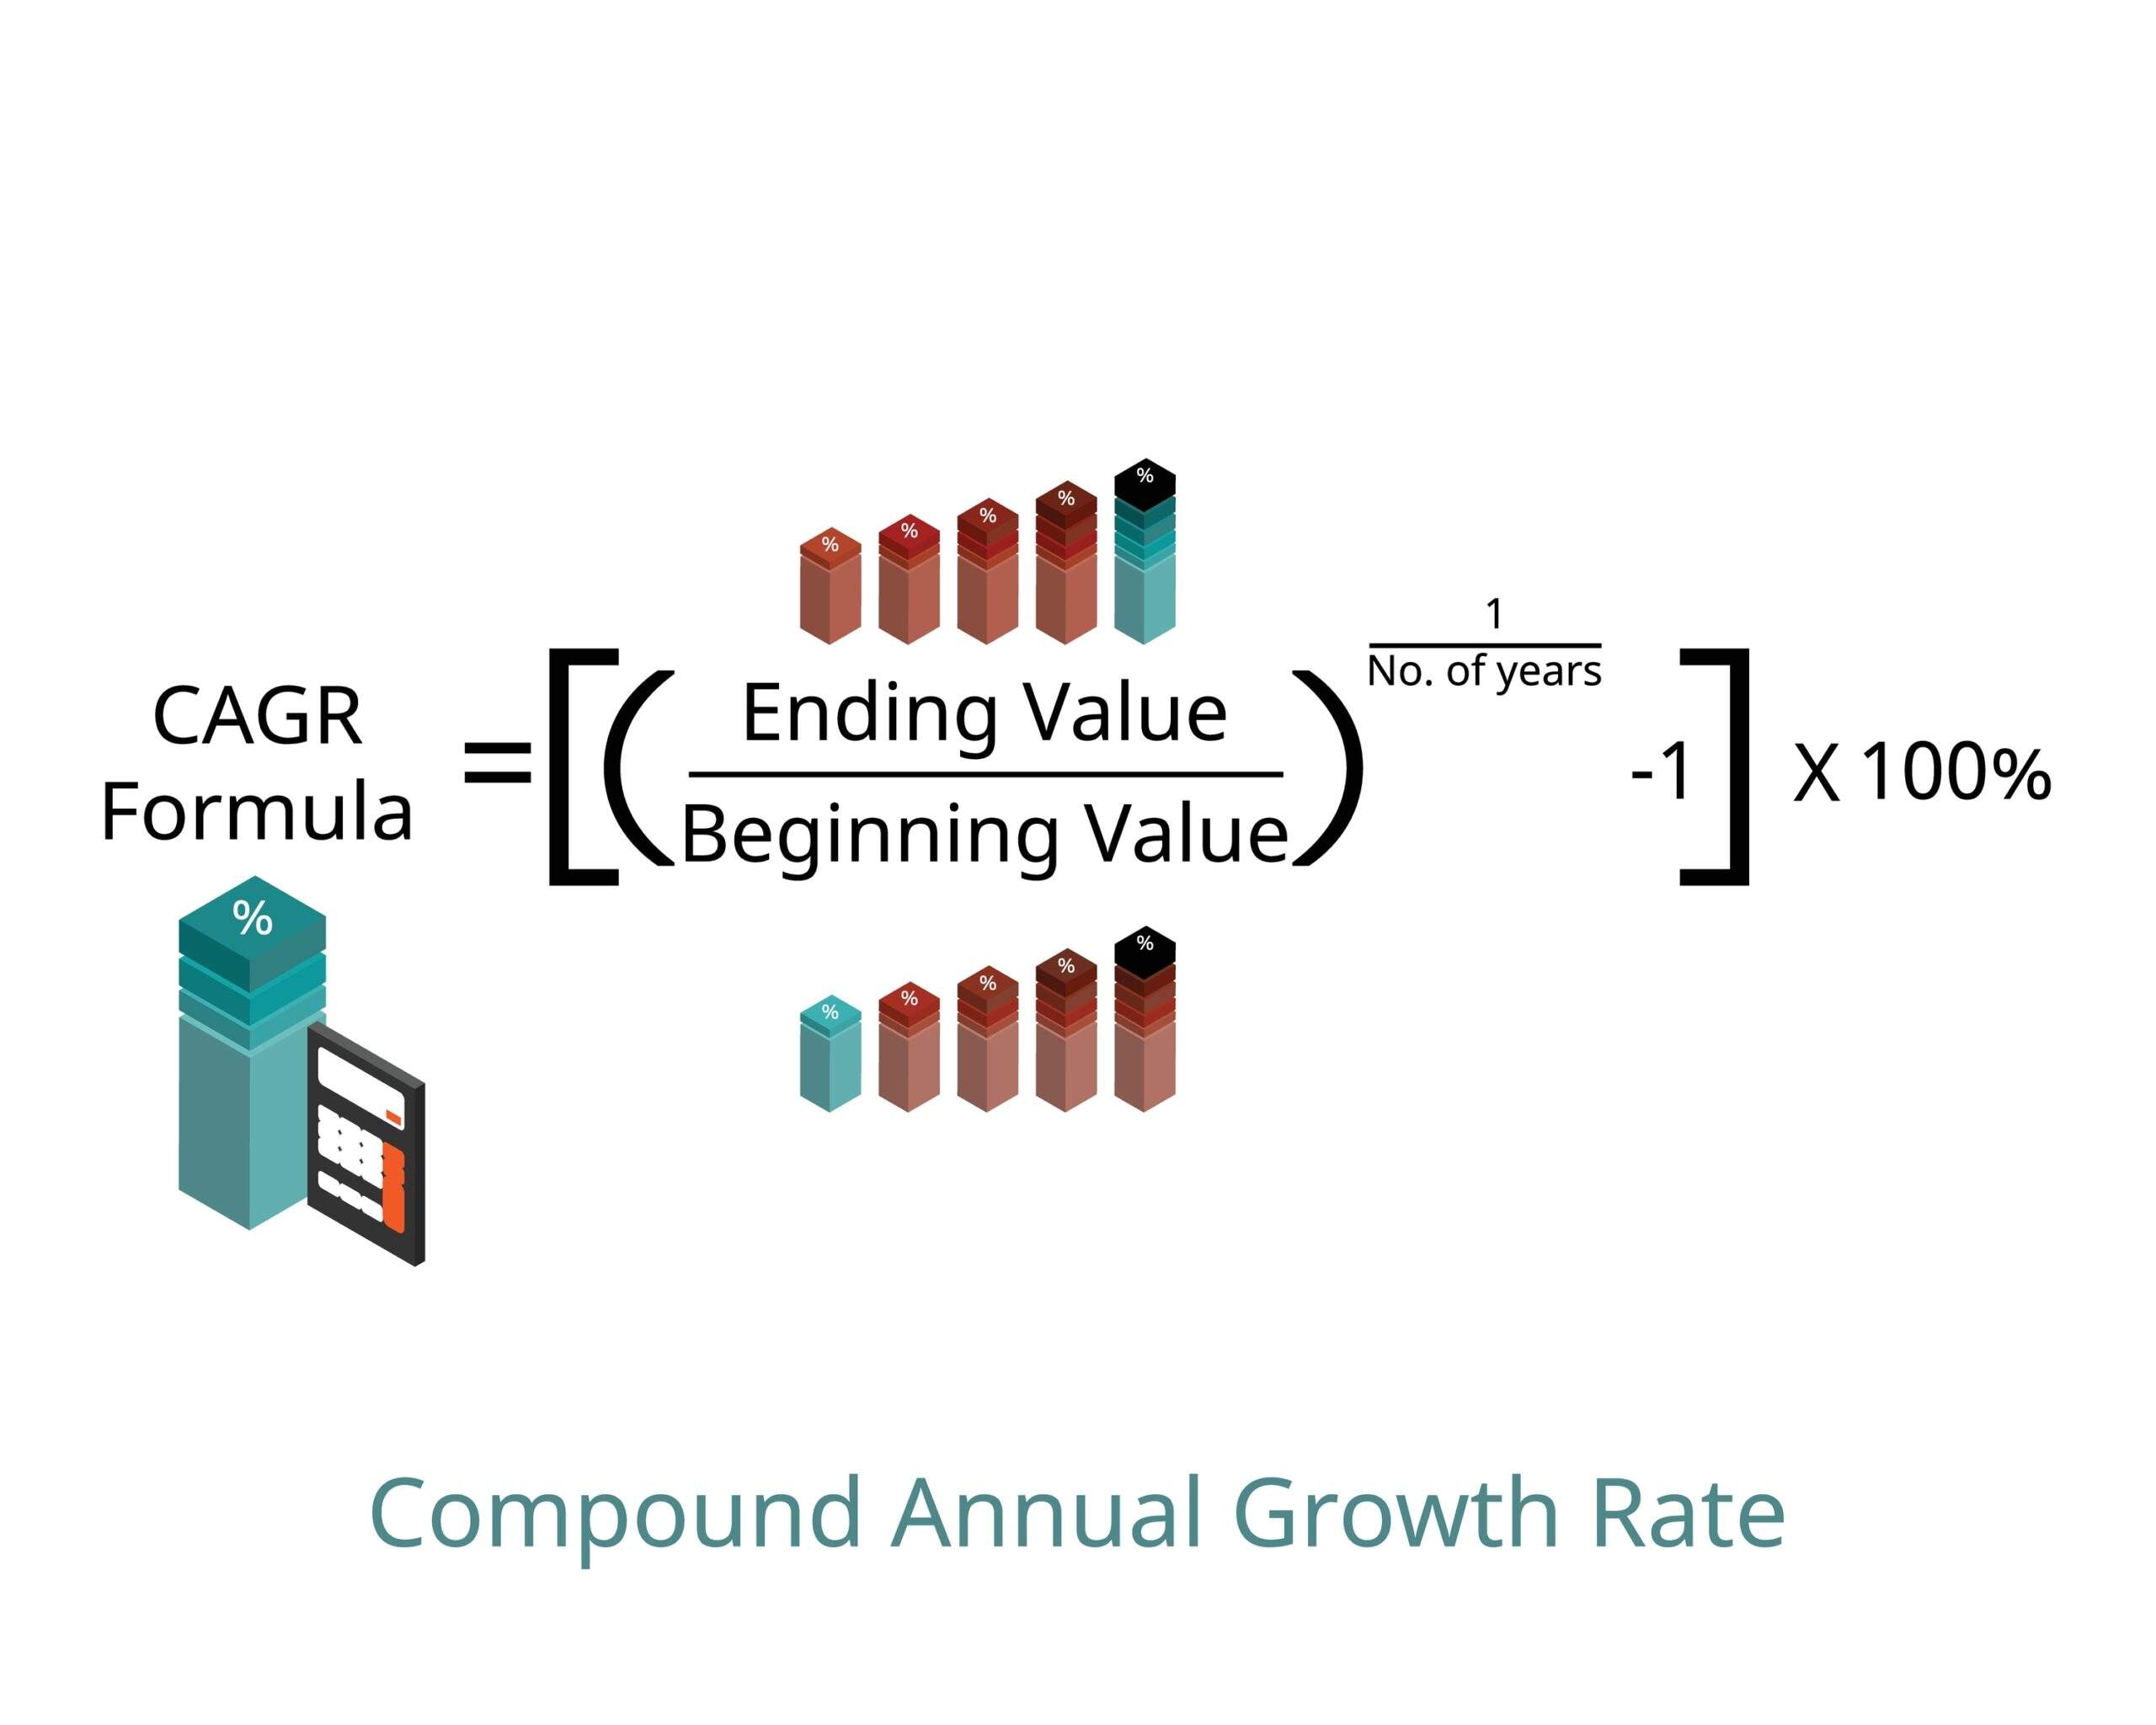
This metric can be compared against its own history of investments, or to its competitors’ stocks in a market sector.
- Technical analysis:
This goes beyond ratios. Technical stock analysis is both macro and micro — big-picture market activity and individual stock performance within its sector.
Stock analysts become historians. They go back to consider years (and even decades) of market data. They look at the supply and demand of a specific market.
Then they become weather forecasters — using graphs and charts of that data to predict how a stock might perform in the future. But instead of a five-day forecast, these predictions can be anywhere from days to months and years ahead.
This is why it can be so difficult to determine which stocks create the best investing opportunities. But in my experience, the best stocks to invest in give off five major signs that they are positioned for growth.
Today I’m going to give you three of those signs. Then I’ll tell you how you can access my five-step strategy for finding stocks with true market momentum.
3 Signs a Stock Has Market Momentum
- An expanding total addressable market (TAM):
A company has to have its own niche within its respective industry in order to survive and thrive. And a total addressable market considers the available market for a specific product or service.
TAM data tells us how much potential revenue a company could make. But along with TAM are two more related terms: serviceable available market (SAM) and serviceable obtainable market (SOM).
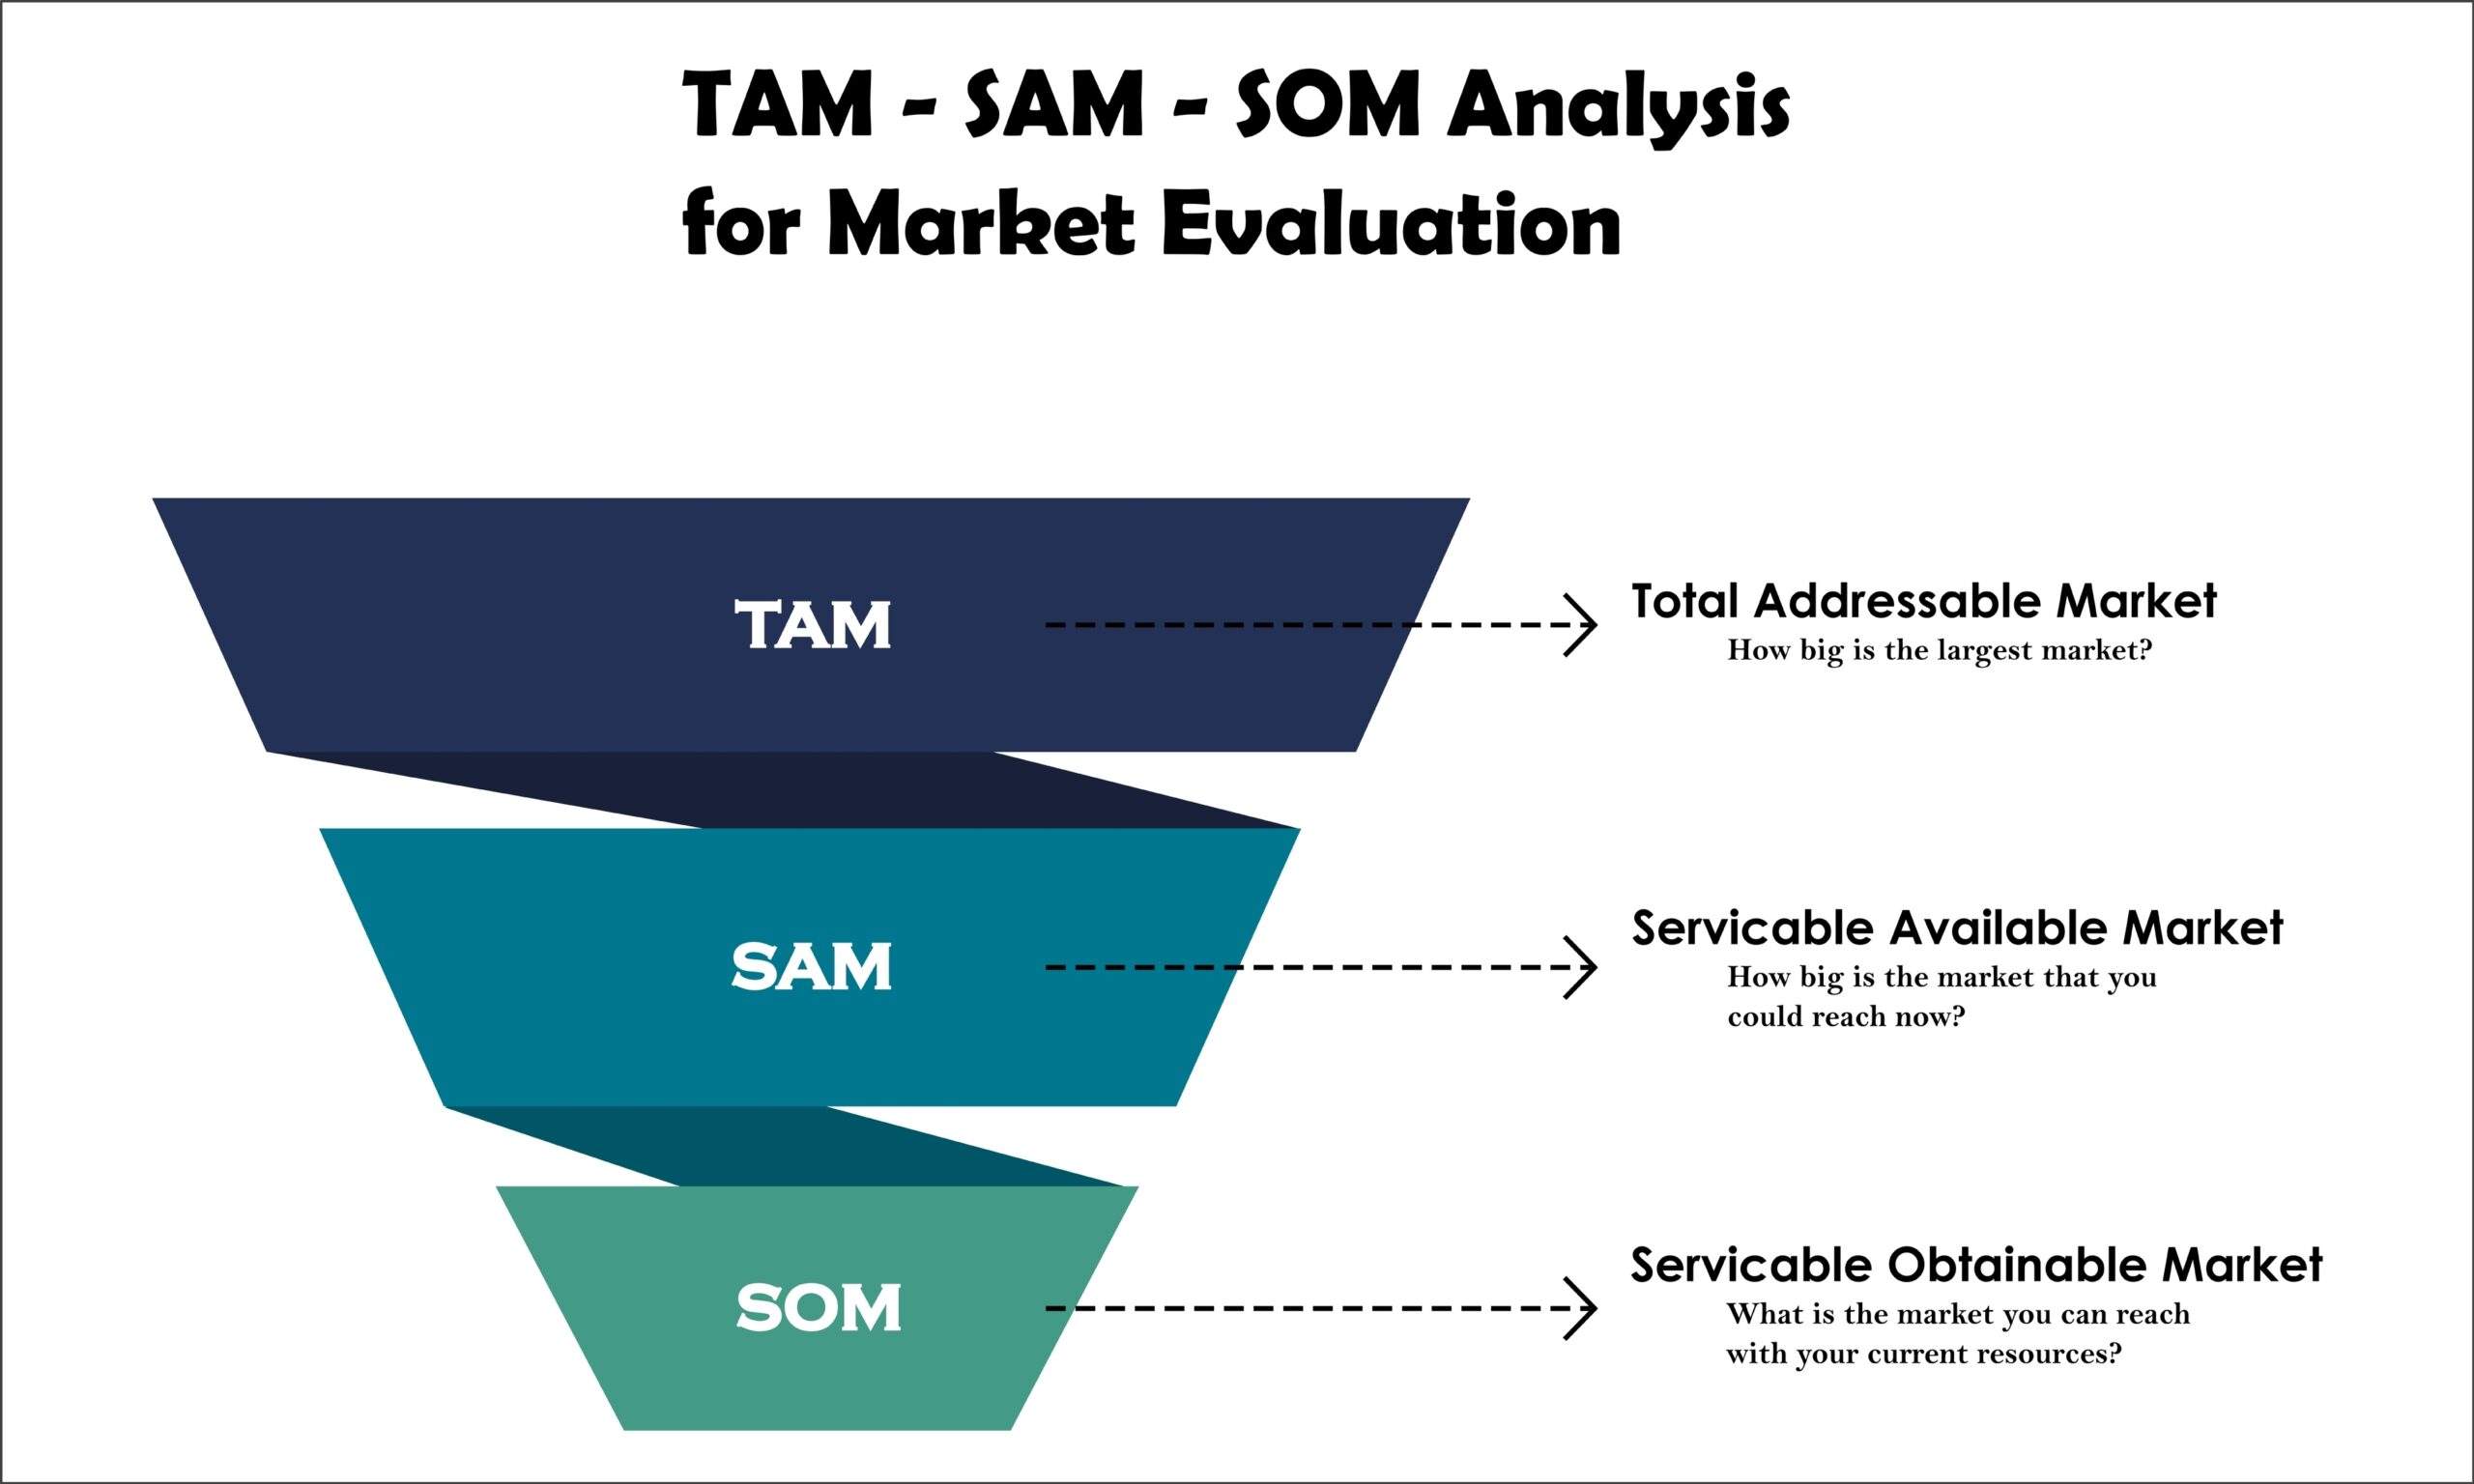
All of these metrics work together to pinpoint how a company is situated in its market, and if it’s poised for growth.
One of the markets I follow closely is the tech sector (which includes many subsectors). I look for companies that are always innovating; specifically ones that will be much larger in 5 to 10 years.
But more than this, I look for companies that are leveraging game-changing technology to create an unfair advantage over their competitors. This makes them more valuable as investing opportunities.
- Projected revenue growth:
This goes back to basic stock analysis. There’s a specific percentage of annual revenue growth I look for in a stock. I won’t give it away just yet, but if you attend my upcoming free webinar, I’m going to share that metric number.
Remember, this is all part of finding stocks that are already showing growth, year over year.
- Beating Wall Street’s estimates:
When a company starts beating Wall Street’s estimates, it means analysts are missing something big happening. When company management revises its estimates higher, it signals that the company’s growth momentum is picking up speed.
Now, I typically look at two other metrics in order to pinpoint stocks with what I call “True Momentum.” But I don’t want to give it all away right here…
Keep reading below to find out how to access the other two parts of my strategy.
How to Invest in the Right Growth Stocks
Navigating the stock market isn’t easy, even for seasoned professionals. The current bear market is especially difficult. But that’s why I’m here — to help you navigate it.
I have a team of analysts helping me research the tech markets, using all the tools and metrics I outlined in this article (and much more). If you want to learn even more about my market momentum strategy (including the last two steps), I have an online event coming out on November 29: the “Crisis Investment Summit.”
It’s all about how you can make money in times of economic crisis (like what we’re experiencing right now), including recessions.
In this free webinar, I’ll walk you through:
- The annual percentage I look for in a company’s revenue growth.
- My analysis of prior bear markets (and how you can make money in them).
- Details about my new special report: 3 Stocks for Triple-Digit Gains in 12 Months.
As always, if you have any questions for me, make sure you reach out at WinningInvestorDaily@BanyanHill.com.
Regards,

Ian King
Editor, Strategic Fortunes