
Famous investor Jim Rogers once said: “I just wait until there’s money lying in the corner. And all I have to do is go over there and pick it up.”
This is high-level stuff, I assure you. But it’s also simple.
Let’s talk through it with a specific example.
One could argue that investing in Apple Inc. (Nasdaq: AAPL) in early 2016 was obvious. All you had to do was study its past moves.
Apple is up more than 37% per year since then. And that doesn’t even include dividends. It’s just capital gains.
If you invested $10,000 in Apple stock on January 27, 2016, you’d have shares worth $51,338 today. The dividends would be worth another $4,104.
Create a Plan
Why that date? Because Jim Rogers said so.
We saw the money lying there. We bought. We gained.
Again, keep it simple.
Let’s say you already use Apple’s products. You love them. You would be happy to own the shares.
Instead of just buying them willy-nilly, though, you create a plan.
One simple method for choosing when to buy a company’s shares is by following its free cash flow (FCF) yield. That’s FCF divided by market cap.
FCF equals a company’s operating cash flow minus its capital expenditures. It’s the money a company has left after it buys another company or pays to fix something important.
Last decade, Apple’s FCF yield first rose above 12% in 2013. It peaked on April 19, 2013. Then shares rose 38% with dividends over the next year.
A company that has consistent positive free cash flow is a solid investment. Apple has done so for 18 years in a row.
You just have to pay the right price. In the case of Apple, it would have made sense to buy it once the yield reached 12% again.
Here’s the chart of Apple’s stock price (white) versus its FCF yield (blue):

Investing doesn’t have to be perfect.
On January 27, 2016, you see Apple’s FCF yield rise to 11.97%. You’re using 12% as your bar, so you buy.
Your plan works.
Shares rise until they take a break at the end of 2018. They will take another break with last year’s virus.
You have a total return of 39.3% per year for a little more than five years.
You waited until there was money “lying in the corner.” All you had to do was “go over and pick it up.” And you did.
It doesn’t have to be trickier than that.
For your information, I ran a screen to learn which S&P 500 Index stock is performing the best using this metric since 2016.
The name that stuck out was Newell Brands Inc. (Nasdaq: NWL). It’s showing healthy growth in price and in FCF yield.
Another Real-Life Application of Simplicity
I gave you this example because it’s important that you learn about Mike Carr’s One Trade system if you haven’t heard about it yet.
I honestly believe everyone should.
If you’re a loyal Smart Profits Daily reader, you know Mike is super smart. He has worked at the highest levels of the Air Force and finance. Not many can say that!
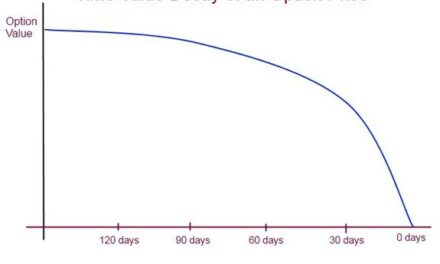
The beauty of his One Trade system is it tracks a whole lot of variables — every day — to tell you if you should do one thing: buy or sell options on the Dow Jones Industrial Average.
That’s it.
The simplicity of his system is key.
Of course, the system is super advanced. Mike has decades of experience trading options. He had the idea for this system 30 years ago!
Since then, he has used all of his knowledge to create a process that tells subscribers to buy calls or puts on the Dow … or to stand pat.
If it sounds simple, that’s because it is.
The results haven’t been, though. He once generated a 313% gain in two days.
That’s not a typical gain, though, and he’ll have losses, too. But you can generate life-changing gains in less than a week. In fact, the average trade is four days.
If you’re a busy person who needs a simple trade — or just don’t want to bog yourself down in minutiae and due diligence — One Trade is for you.
Good Investing,

Editor, Profit Line