Stocks have been falling since January. Yet this isn’t an official bear market.
The S&P 500 Index fell just 11.8% to its low so far. A bear market officially requires a 20% decline.
But the recent market action probably feels like a bear market to many investors. That’s because most stocks are in downtrends.
We can define the direction of a trend in several ways. One of the simplest is with a moving average (MA).
The MA shows the average price over a recent time period. Each day, the average moves with the market, throwing away older data and using only the newest data.
When the most recent price is above the MA, the trend is up. Downtrends are times when the most recent price is below the MA.
This data will also let us know when the market decline ends.
Significant Market Declines
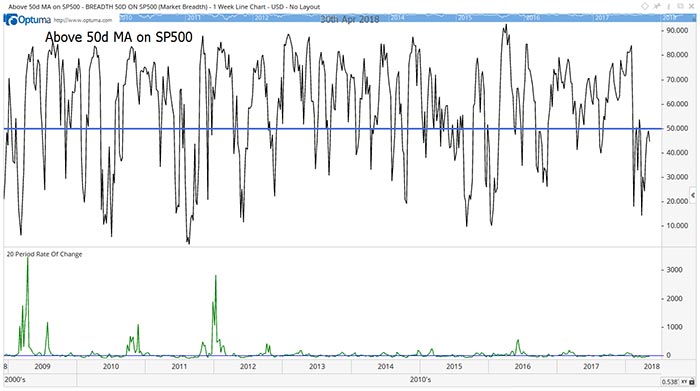
Using the MA, we can see that most stocks are in downtrends. The chart below shows just 44.6% of stocks are above their 50-day MA.

The 50-day MA is a popular trend indicator. It includes almost three months of data. Analysts also use the 200-day MA to define the long-term trend and the 20-day MA for short-term trends.
The trends in these indicators explain why investors feel like this is a bear market. A bare majority of stocks, 50.3%, are above their 200-day MA, while just 44% are above their 20-day MA.
New uptrends begin with a “burst of energy.” The change in the number of stocks above their 50-day MA jumps sharply higher. That signal is shown in the next chart.

The 20-day rate of change of the indicator is at the bottom of the chart. The upward bursts show important market bottoms.
These bursts occur as traders rush into stocks. And, most important, we see bursts like this after all significant market declines.
This is a significant market decline. The sell-off is the first 10% decline in more than a year. That alone makes it significant.
The length of time the decline has lasted also makes it significant. A typical 10% correction in the S&P 500 lasts about 50 days. This decline has now lasted more than 60 days.
As the decline continues, more and more traders will become pessimistic. Pessimism leads to more selling. But, eventually, the selling will end.
When it does, prices will rally sharply, and the number of stocks trading above their 50-day MA will spike, just like it always has.
That will be the buy signal.
The Cautious Approach
For now, there’s no need to rush into stocks. With most stocks in downtrends, smart investors will be selective.
It is true that there are some bargains in the current market. But there is also higher-than-average risk in the current market.
The most cautious approach is to wait for a rally. There will still be time to invest after this indicator gives a buy signal.
Regards,

Michael Carr, CMT
Editor, Peak Velocity Trader


