To analyze stock market indexes, it helps to look beyond price. Market breadth is the way to do that.
Breadth indicators count the number of stocks that pass a test. For example, the test might be whether a stock closed higher for the day. That’s done with the advance-decline line (ADL). If more stocks are up than down, the ADL moves higher.
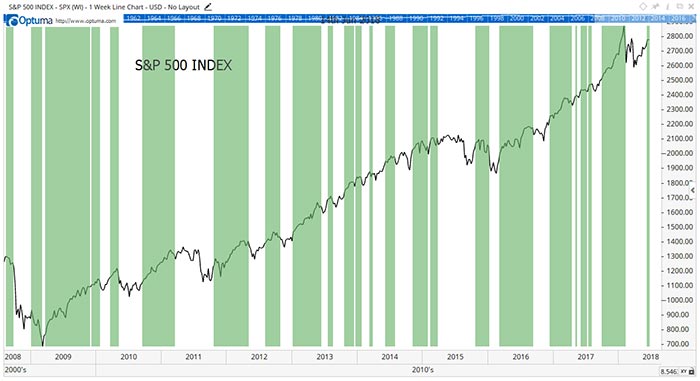
The chart below shows the results of a more sophisticated breadth tool. Green bars show when most of stocks in the S&P 500 Index are on MACD buy signals.

MACD is a popular momentum indicator. It’s a slow-moving indicator using 26 weeks of data. That quality is ideal for long-term market analysis.
By moving slowly, there’s little chance of a quick reversal. It takes time for a sell signal to develop. And that’s good news for investors.
Looking at breadth of the MACD, we learn whether most of the stocks in the index are in long-term uptrends or downtrends. Knowing the broad trend like this can improve our long-term results.
When this indicator is bullish, sell-offs are relatively minor. The index has never fallen more than 17% when at least 50% of the stocks in it are on MACD buy signals. Now, 17% is a big decline. But it’s better than the declines of more than 50% that occurred when the index was bearish.
We are on a new buy signal. MACD breadth turned bullish on June 8. This reverses a bear market signal that came near the top of the stock market in January.
This breadth indicator buy signal means investors should be aggressive. There is little risk of a steep market sell-off. The S&P 500 should reach new highs soon.
So, now is the time to buy tech stocks and other fast movers. They offer the most reward in a low-risk stock market.
Regards,

Michael Carr, CMT
Editor, Peak Velocity Trader


