

Be prepared.
That’s what we try to help you do on these pages.
At the beginning of the year, I penned a series of essays to make you aware of some rare market action.
They were remarkably accurate. If you followed them, you could have made a lot of money.
Well, déjà vu. You need to be aware of something happening today…
Technical Analysis Is Important
Technical analysis can give you an edge.
Analysts dig into numbers to find profitable trends we don’t see very often.
I just observed a market anomaly that has only happened four times.
The first three of them resulted in quick drops in the stock market.
The fourth just occurred on October 9.
Follow the Moving Average
Comparing the movement of an index to its moving average (MA) can tell us its next move.
The MA of a stock is simply the average price it has traded at over a given period.
On January 26, 2018, the S&P 500 Index closed 350 points above its 200-day MA for the first time.
The market peaked that same day. It then fell more than 10% over the next nine trading days.
You can see the peak and the fall on the left half of this chart:
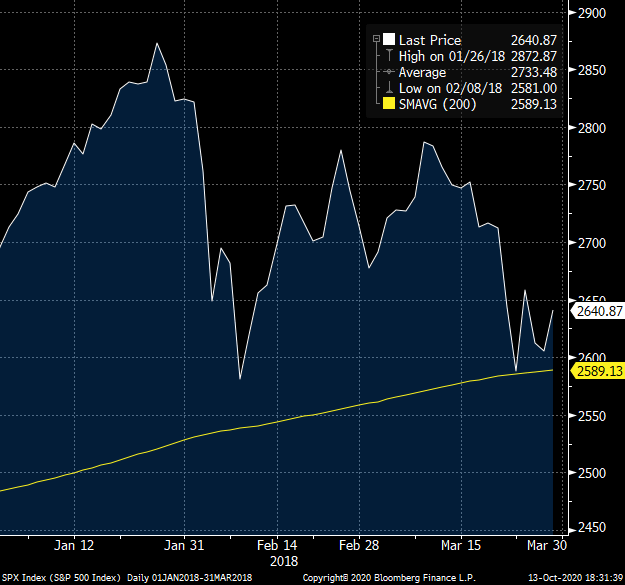
There isn’t anything special about the number 350 per se. To date, however, it has always prefaced something going wrong in the market.
Since 2018, we’ve seen the gap between the S&P 500 and its MA grow to at least 350 three other times.
In the chart below, the S&P 500 is the orange line. The gray line is the 200-day MA minus the index itself.
When the variance between these two numbers gets out of whack, the index tends to adjust:
When the Market Deviates Too Far From Its Moving Average, It Adjusts

(Source: Bloomberg, internal calculations)
On February 12, the index exceeded the MA by 351 points.
The market peaked seven days later. It fell nearly 34% from February 19 to March 23, kick-starting the COVID-19 stimulus.
On August 24, the index and its MA again skewed by more than 350 points.
The variance exceeded 350 for nine trading days, and the market peaked on the eighth. That was September 2.
The S&P 500 fell almost 10% over the next three weeks.
The third — and most recent — time the two numbers reached our hurdle was last week. On October 9, the index exceeded the MA by 360 points.
What Does This Mean?
We need to tread carefully.
Since October 9, the S&P 500 has been flat.
It may have peaked on October 12. We can’t confirm that yet.
But the market triggers these indicators for a reason.
I believe it’s the right time to take it easy.
If you are super leveraged to stocks, consider taking some off the table or delay a purchase you were going to make.
Yes, Congress may pass a stimulus bill. But the market is already factoring some portion of that appreciation into prices.
We may even get a sell-the-news moment.
When you stop and think about this, it makes sense. This market has zoomed 56% higher since March 23.
There is a whole lot of uncertainty out there today. And it will remain through Election Day on November 3.
Be prepared. And be careful.
Good investing,

Editor, Profit Line