Stocks continue climbing a wall of worry. And there are certainly a lot of worries.
Tariffs and a possible trade war probably top the list of worries for many investors. But if that’s not enough, Turkey is now imploding, and tariffs are playing a role.
Sanctions against Iran are also a concern. Those sanctions could disrupt the oil market, and spikes in oil led to recessions a few times.
There’s also an economic and societal crisis in Venezuela. That could lead to a wave of refugees that could potentially emigrate to the southern border of the United States.
And don’t forget North Korea. No one seems to be sure, but there is either peace breaking out in the Hermit Kingdom, or the North Koreans are preparing a military surprise.
If you want to focus on worries closer to home, there’s inflation. There’s also increasingly shrill political rhetoric and an election in less than three months.
But there is some good news for investors: None of this makes any difference to the stock market.
The Price Action Tells Investors All They Need to Know
Many investors worry about the news. Yet stock prices are ignoring all that. Most stocks are simply moving higher.
There are several ways to measure the direction of the trend in stocks. The simplest is to compare the price to a moving average (MA). If the price is above the MA, the trend is up.
Analysts use a variety of MAs with this technique. The most popular is probably the 200-day MA. That MA defines the long-term trend.
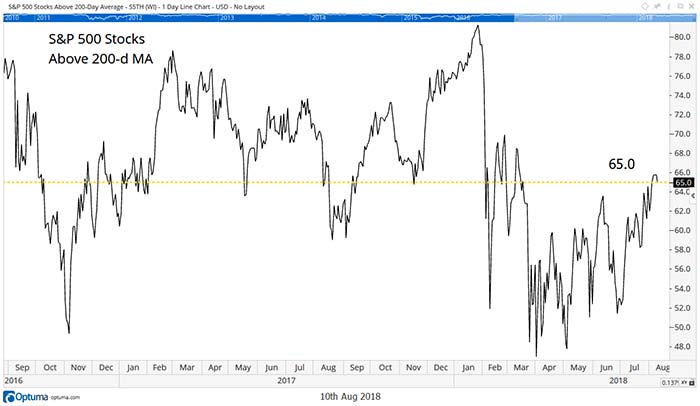
The chart below shows the percentage of stocks in the S&P 500 Index that are above their 200-day MA, which means they are in long-term uptrends. Readings above 65% are buy signals.

To develop a trading strategy from this indicator, we need a sell signal. I use readings below 60% as sell signals. That avoids short-term trades lasting just a few days that can occur when the indicator moves above and below the 65% level quickly.
There aren’t a lot of trades with this strategy.
In the past 10 years, this strategy gave 20 buy signals, and 17 of them (85%) were winners. The most recent buy signal came on August 3.
These signals have a high probability of success. But, more importantly, they signal that risks are low. The largest loss with this simple strategy in the last 10 years was just 4.1%.
This indicator adds to the growing evidence of a bullish stock market. The price action, and many technical indicators, are saying now is the time to buy stocks.
With so many indicators giving buy signals, expect a big move. The S&P 500 is set to gain more than 10% in the coming months.
But the news seems to be saying investors need to prepare for a market crash.
It might be tough to do, but investors should ignore the news. Now is the time to be aggressive since risks are low.
Small-cap stocks and aggressive trading strategies using call options will help investors benefit from the uptrend.
Regards,

Michael Carr, CMT
Editor, Peak Velocity Trader


