Gold prices are on the cusp of their longest seasonal uptrend of the year — from now through late November.
But after bottoming in December, the precious metal is a bit ahead of its seasonal pattern this year, putting the late-year rally in question.
Technically, the 10-year seasonal uptrend started on July 9, and, like clockwork, prices jumped.
But I’m still short gold prices. Here’s why…
I follow the 10-year seasonal trends and trade them all the time (which means I will be long gold soon), but I am also aware the trends don’t always pan out as expected.
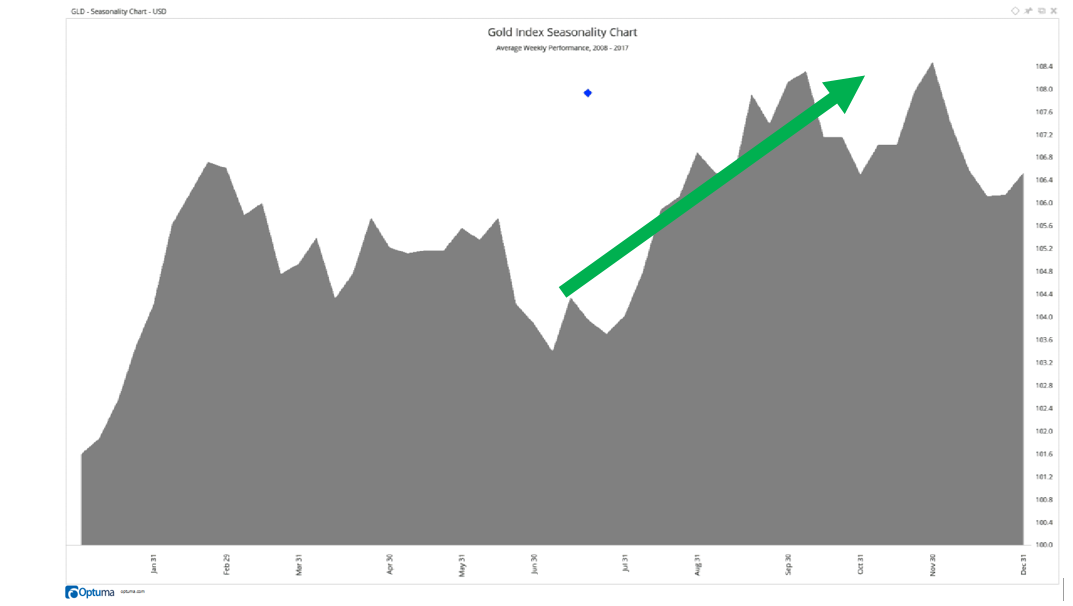
Here’s a look at the 10-year seasonal pattern for the Gold Index:

The green arrow indicates the seasonal uptrend from July through November.
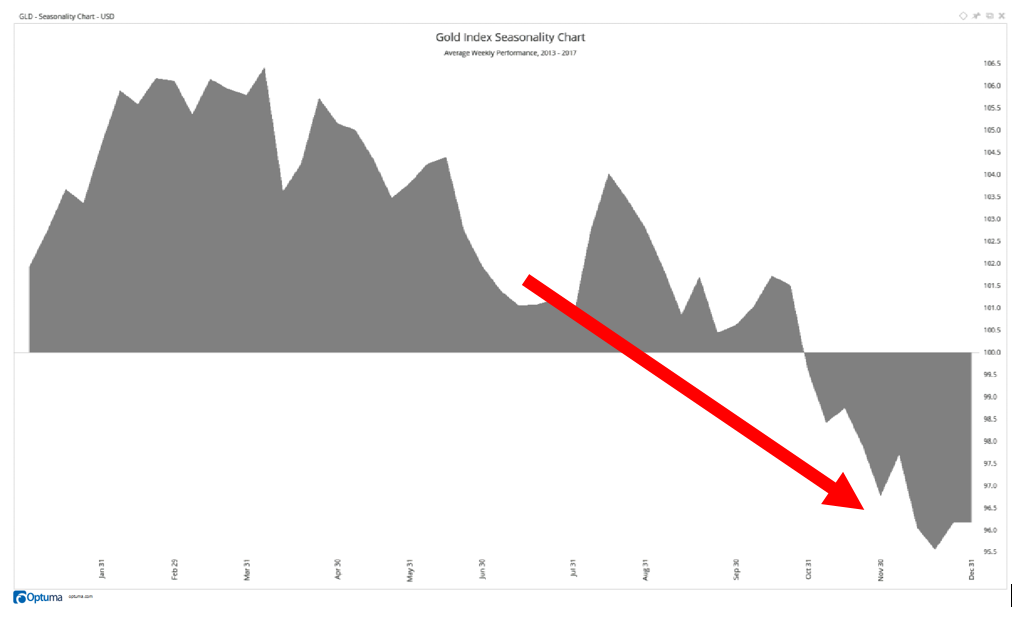
Now, take a look at the five-year seasonal trend for the same index:

That’s a much different seasonal trend.
I prefer to stick to the 10-year pattern since that is the longer-standing seasonality of the precious metal. Using 20 years is too far back, and five years is too short to me.
But this example goes to show that seasonality shifts from year to year. That’s why I incorporate other indicators to assist me in timing these trends.
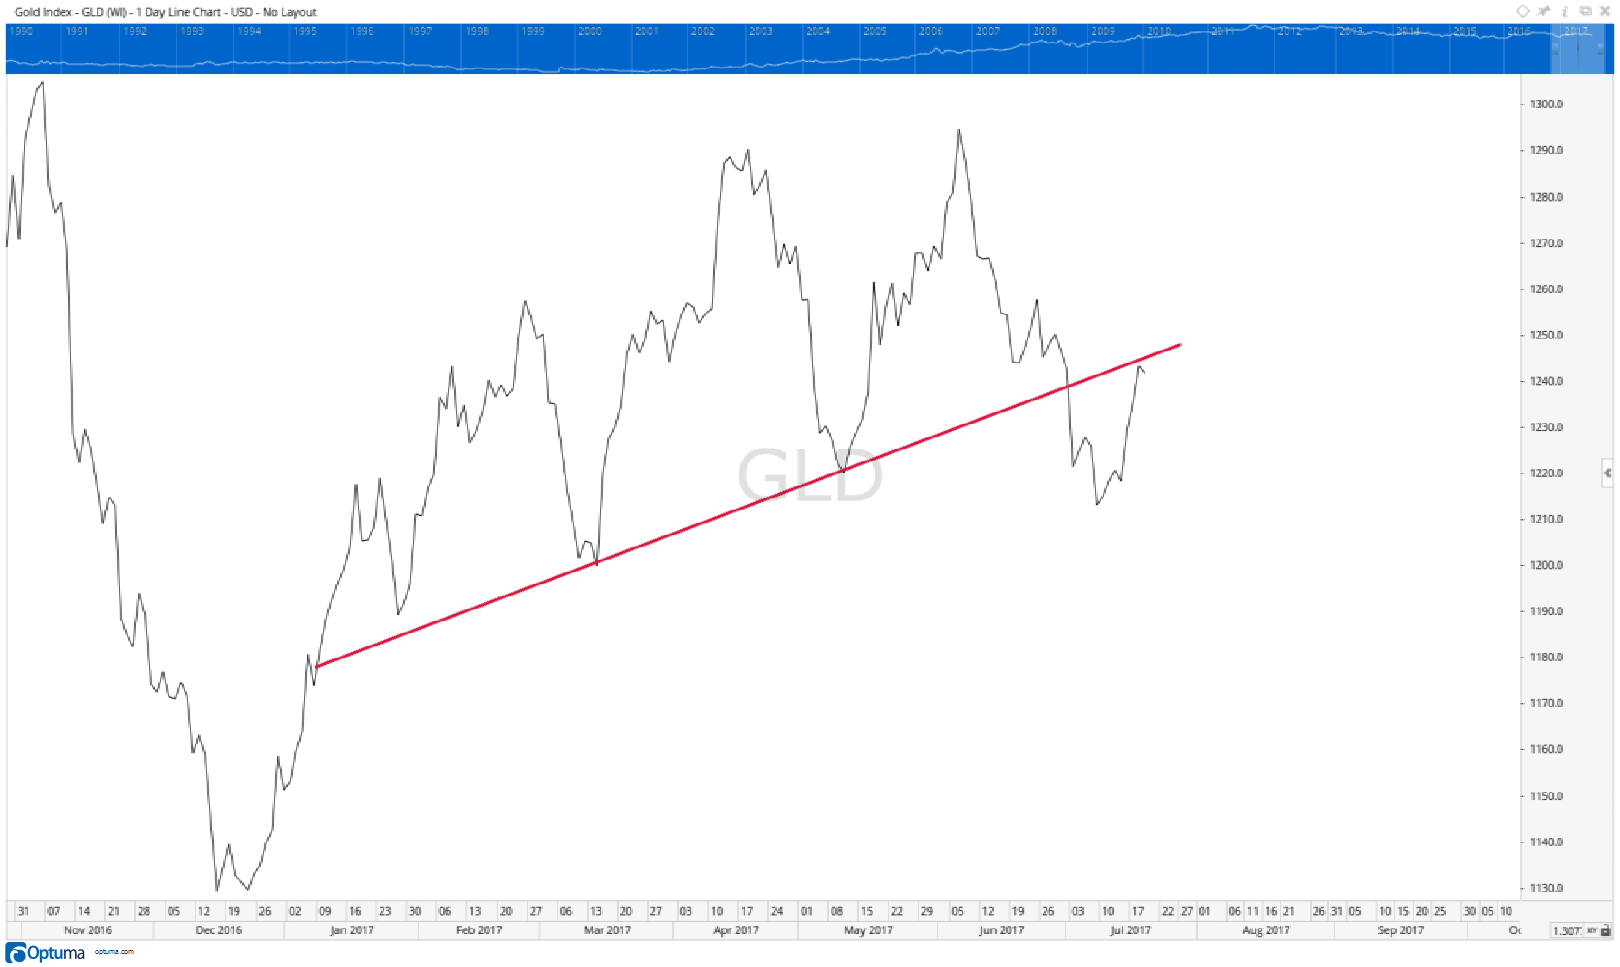
And in the Gold Index, there is a key trend line I’m watching right now.

The red trend line acted as support since the start of the year, being tested three times and only having the index fall below it a few weeks ago. That’s why I haven’t sold my position to short gold — I’m waiting for another drop lower.
This trend line now acts as resistance for the index, and if it can hold below that, we can see gold tumble toward $1,200.
If it breaks above that trend line, I’ll join in on the seasonal gold uptrend that lasts from now till November.
Regards,

Chad Shoop, CMT
Editor, Automatic Profits Alert


