

With interest rates on the rise and tough talk from the Federal Reserve, Clint Lee is reminded of the old adage that: “When all you have is a hammer, everything looks like a nail.”
In today’s episode of Your Money Matters, Clint goes over the Fed’s tough new strategy — and what it means for traditional portfolios all over (spoiler alert: it’s not good).
Click here to watch this week’s video or click on the image below:
Transcript
Everyone, Clint Lee here with Your Money Matters. Now you’ll notice I do not have Ted here with us today. He is out on vacation this week. It’s Friday as I’m recording this. But have no fear, he is back this week and so you will be hearing from him here soon. Before we get started, just a quick reminder to click the link. It’s above my left shoulder, I believe that’s the top right of your screen, to learn how to get started with The Bauman Letter. Also, if you like this video, please click the “like” button. If you have comments or questions, please leave those below.
Today I want to talk about the Federal Reserve and why it wants to break the markets. Why do they want to break the markets? When I talk about markets, I’m not just talking about stocks. I am talking about stocks and bonds. This has major implications for investors, for retirement savers in particular, just given how bonds and stocks tend to complement each other from a diversification standpoint and portfolios. But we’ll look at historical precedent for how this could play out, as well as one ticker you want to check out to make sure you’re properly diversified here in this environment.
With that first, something I started thinking about this week as we’ve seen the Fed really embark on this big hawkish pivot, it got me thinking about a play set that I used to have in my backyard a couple years ago. You may be thinking, “What in the world does a play set have to do with the Fed?” Well, my kids love this play set, but they grew out of it, they got too big and so we wanted to get rid of it.
Now, it’s one of these big wooden structures with a slide, a couple swing sets, and my wife, she wanted me to take apart the play set with this. She wanted me to go through methodically, take my time, take it apart properly, store the pieces because it was in decent shape and maybe someone else would get a use out of it. But that was going to take quite some time. I preferred to go out to use this. Maybe this along with my chainsaw as well. I wanted to get it done quickly.
I wanted to be done with it. I didn’t want to spend all day screwing with it. I wanted to take the hammer to that play set and be done with it. What does a hammer and a screwdriver have to do with the Federal Reserve? Well, for the better part of the last decade, we are used to seeing a Federal Reserve, when they wanted to implement some change in policy, it was slow, it was incremental, it was methodical, it was put out there well in advance in terms of the communication channels. We are seeing a much different Federal Reserve here today.
They’re not taking the screwdriver approach. They are taking the hammer to this market, and it might be just starting. I want to talk to you, I want to show you some evidence for what I mean by this. I want to look at some comments from a former Fed official that came out this week that caught my attention here. Former New York Fed President Bill Dudley came out this week in an opinion piece for Bloomberg and made some choice comments:
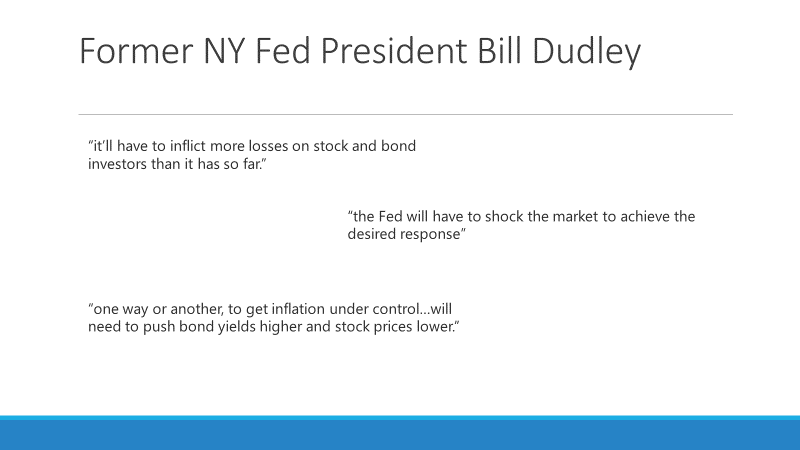
I picked off some stuff from his opinion piece that really caught my eye, such as talking about the Fed. What does this have to do with getting inflation under control? What does moving bond yields higher and stock prices lower have to do with inflation? After all, we know the causes of inflation. Here’s a chart of CPI, your change in CPI going back to the 1970s:
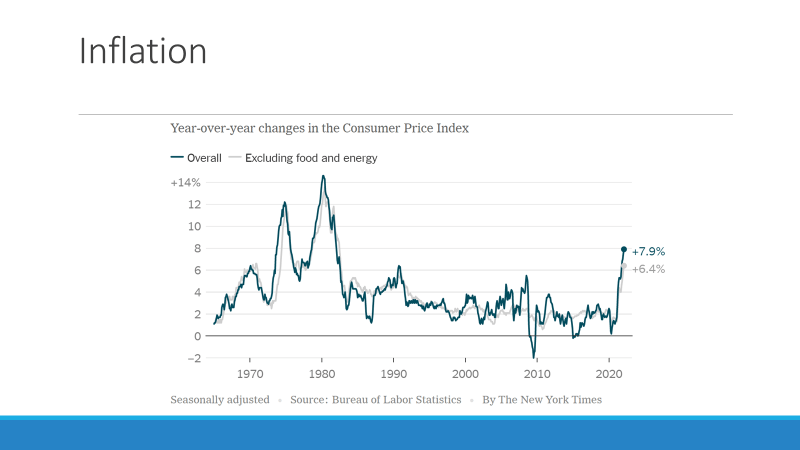
Right now, the levels that we’re seeing are being caused by multiple catalysts. We had stimulus payments that came out during the pandemic that put money directly in consumers’ pockets. That money’s chasing goods around. That’s pushing up the price of those goods. You have the ongoing supply chain issues as we continue to see COVID and the pandemic cases rise and fall around the world. Look at what’s going on in China right now, in Shanghai. You’re continuing to see an impact to supply chains, and then you got the conflict in Europe as well. Just all these different catalysts coming together to move inflation higher like this.
But with Bill Dudley’s comments, what in the world does stock and bond prices have to do with getting inflation under control? The Fed can’t fix the supply chain issues. They can’t do anything about the situation in Europe, but what they can do is impact the levels of aggregate demand. They can impact the levels of aggregate demand coming from consumers, coming from businesses. Consumer spending and business investment makes up somewhere around 85% to 90% of GDP.
The one mechanism, the one way that they can do that’s at least indirectly is by impacting financial conditions. What do I mean by financial conditions? When I think about financial conditions that are optimal for the economy, for the stock market, I think about the plentiful availability of cheap credit. Once again, credit that is cheap and is readily available. Whether it’s a business wanting to borrow money to spend on expansion, hiring, whatever the case may be, or consumers borrowing to buy a house or a vehicle or whatever the case may be.
When credit, once again, is cheap and plentiful, that helps facilitate that process, and that means financial conditions are loose. Now, what the Fed wants to do is they want to tighten financial conditions. Let’s take a look at a chart here really quick and see what financial conditions, where they’ve been, where they’re at right now, and where the Fed wants to see them go. This is a chart of financial conditions. This metric actually comes from the Chicago Fed district. They put this together. This goes back to about the start of 2000:
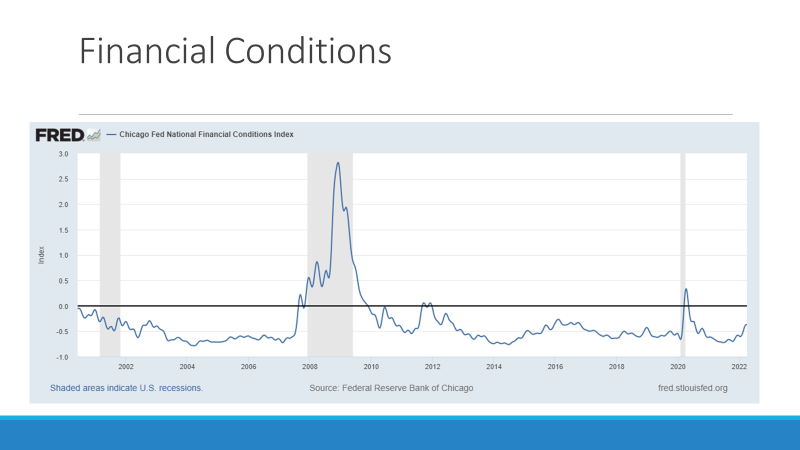
Couple levels to call in here. One, this black line across the middle here. That’s at this zero line. That’s average. Now, when financial conditions are below this line, that means conditions are loose, that means markets aren’t stress, credit’s available. Credit’s available at cheap prices, and that tends to be inflationary. When you start to get above this black line, that is when financial conditions are tightening, and that tends to slow economic growth.
If we look at where we are now versus where we’ve been, we’ve seen conditions tighten off these low levels coming off the pandemic, but we’re still running at below average level. Despite what we’ve seen so far this year with stock and bond markets, and as stressed as you might be feeling about what’s going on in the markets right here, financial conditions from a historic perspective are still pretty loose. Now, let’s take a quick look at an example of how financial conditions translates to the real economy.
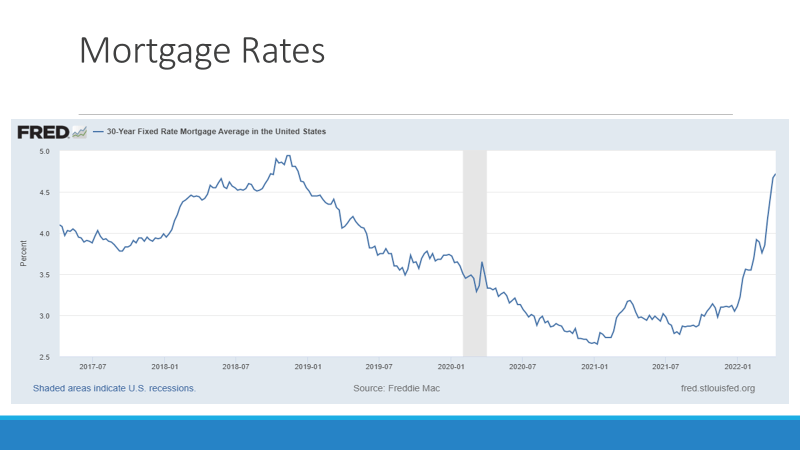
You’ve seen a great example is with mortgage rates right here. As mortgage rates were just at these rock bottom levels between two and a half, 3% down here coming out of the pandemic, just absolutely fueling, helping to fuel a housing boom. But as inflations picked up and as the Feds made a big pivot in policy, look at what’s happened with mortgage rates. We’ve gone from 3% all the way up to over four and a half percent in a very short period of time. Now, these rates, they’re still low from a historical perspective.
But once again, this goes to show how the Fed and their actions, things that they can do to influence what’s going on in stock and bond markets and how that can translate through to the real economy. This gets back to Dudley’s point about falling bond prices and falling stock prices to get inflation under control, because those things will help tighten financial conditions, and tighter financial conditions will start to impact aggregate demand. Now, here’s the other thing that’s striking. The Fed hasn’t even really had to do anything yet.
Now, this is a case where words are speaking louder than actions. All we’ve had so far, in terms of tightening monetary policy, is they’ve stopped quantitative easing, they’ve stopped those new bond purchases, and they’ve raised interest rates, but only by a quarter point. But look at everything they’ve done to talk about what they’re going to do. We’ve now seen the most recent Fed minutes that the talk about quantitative tightening, where they’re going to start to let bonds roll off their balance sheet to the tune of up to $95 billion every single month.
They’ve talked about quickening the pace that they’re going to hike rates. Maybe instead of doing a quarter point that subsequent meetings, maybe doing a half point. Once again, these words are speaking louder than just their actions so far because of the impact it is having on the markets right here. To see what I mean, just look at the chart of the yield curve right here. This is comparing two-year Treasury yields to the 10-year Treasury yields. Once again, they’ve only hiked rates so far by a quarter point, yet the 2-10 Treasury curve is almost inverted, as you can see right here:
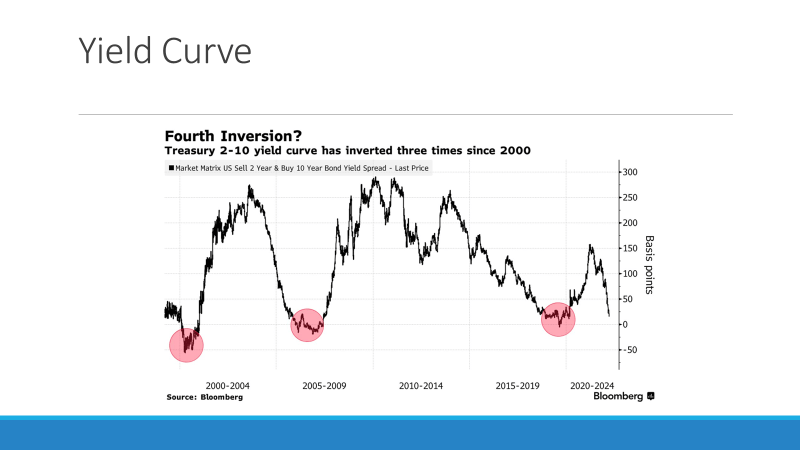
As this line gets closer to zero, that means two-year yields are about on par with 10-year yields, and this is one of the reasons we’ve had such a rough start to the markets this year. Look at past instances when this has occurred. This is right before the pandemic-driven bear market, before the financial crisis, before the dot-com bubble. Once again, just by what Fed officials are coming out and saying is enough to spook the markets right here without them having to really do anything.
That brings me to my next point. If stocks are falling, if bond prices are falling, where do investors hide? These are supposed to be diversifiers, right? When one zigs, the other zags. That has not been the case this year. Let’s take a look at a chart here really quick that shows the quarterly performance for the last several years of a traditional 60/40 portfolio. A 60/40 portfolio, this is the cornerstone retirement portfolio, 60% allocation of stocks, a 40% allocation to bonds:
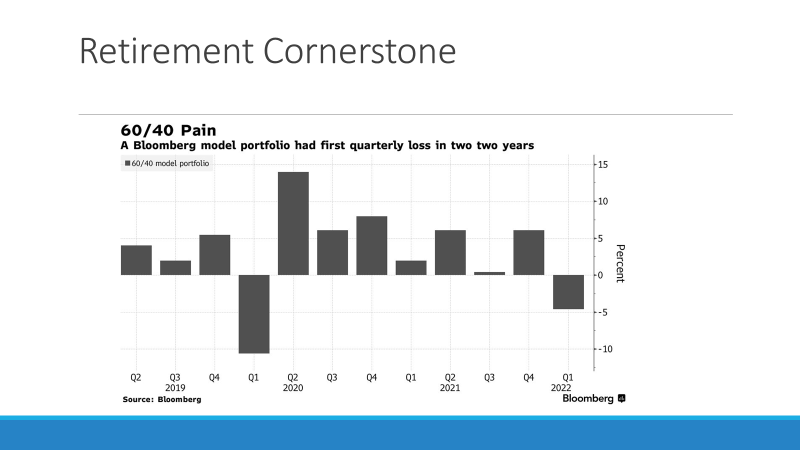
For the better are part of the last decade, it has just been the Goldilocks environment for this kind of portfolio, because you’ve had a persistence fall in interest rates and that’s boosted bond prices. At the same time, you just had this sustained secular rally in stocks, but that came to a halt here in the first quarter. Here’s how that portfolio fared in the first quarter. Really no place to hide. Once again, stocks and bonds falling, so that this 60/40 portfolio was down almost 5%.
The worst showing since the pandemic bear market back in the first quarter of 2020. That would be more helpful. Now, this is a more recent time period, and that’d be helpful to zoom out on the 60/40 portfolio and look at drawdowns in other types of environments that share similarities to what we are seeing to … Here’s a longer-term look at what the drawdowns for the 60/40 portfolio look like, all the way back to 1900. This is data put together by Goldman Sachs:
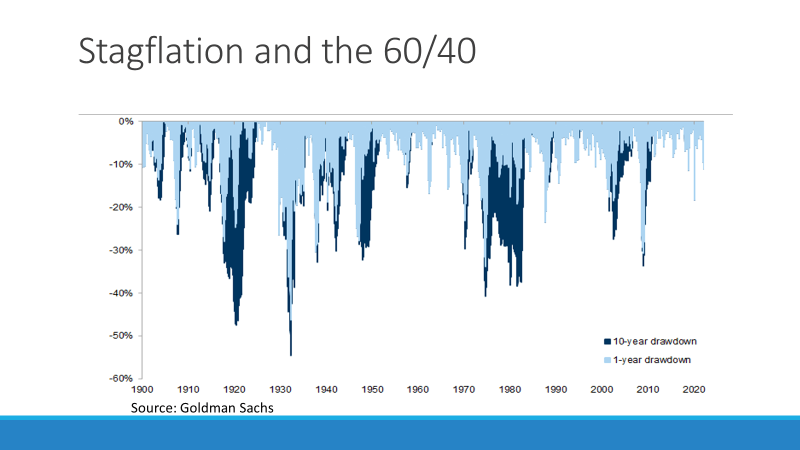
The lighter blue bars on here, this is what the drawdown looks like over a rolling one year period.
The darker blue bars on here are what that looks like over a more drawn out timeframe over a 10-year period. As I mentioned, if you look at really the most recent decade, we haven’t seen very many sizable drawdowns in this portfolio. Now, the one big concern, the one timeframe, time period that everyone talks about right now, that everyone’s concerned about right now, given the similarities is what is a stagflation from the ‘70s and ’80s. If we start to see a similar performance, similar drawdown that we had back during that time frame, watch out.
Look at these, even just these one year drawdown numbers. Once again, in this 60/40 stock to bond mixed portfolio, drawdowns approaching as much as third year, even 40% on a one year basis. Putting it all together, what does this mean? Well, if the Fed is going to hammer the markets, if they want to see both stock and bond prices drop so they can tighten financial conditions because they think that’ll help them to get inflation under control, then you need to reconsider what it means to be diversified.
If stocks and bonds are falling together, you need to rethink the traditional 60/40 approach, and one area to consider that I would recommend looking at for diversification is with real assets, things that do well during inflationary periods, things that did well during the stagflation period in the 1970s and early 1980s, and that’s with real assets. That is with commodities, companies exposed to infrastructure, REITs with, with real estate. These are the areas, once again, that hold up well when we’re in this type of inflationary environment.
This is real assets. It’s one area to make sure that you’re looking at. If you have an exposure there, just to be properly diversified in consideration of that traditional 60/40 portfolio. The one ticker I have here to take a look at is with the RLY. This is a multi-asset real return ETF. It’s not exposure to just one real asset area in particular. It has exposure to those areas I mentioned there just a moment ago.
Well, that is it for me this week. Thank you for joining me today. Just remember, please check out the link above my left here to learn more about The Bauman Letter and how to get started, and make sure you please hit that like button if you found this video helpful. That’s all for me. Have a great week.
Good investing,

Angela Jirau
Publisher, The Bauman Letter