For better or worse, 2024 has been an especially exciting year for investors.
As recently as June, the experts thought inflation would persist for months (if not years) to come…
But after a sharp and unexpected decline in CPI, the Fed decided to cut rates.
For over a year and a half, the “Magnificent Seven” dominated stock market returns by leading the AI revolution…
Now the market’s best-performing sector is utilities.
And back in May, our colleague Addison Wiggin over at Grey Swan started predicting that Biden would drop out of the race.
The mainstream media scoffed at his prediction at first — then, just a few months later, Biden was out.
But despite the political upheaval, you’re holding steady.
According to a recent Money & Markets poll, 75% of you aren’t changing your investing strategy as November 5 approaches.
With both campaigns now entering the final stretch, you can expect to be inundated with political advertising and mind-numbing media coverage for the next two months.
It’s easy to get lost in all of the hubbub and headlines related to the cycle.
The important thing for you, the savvy investor, is to keep a clear head and not get lost in the weeds. That’s not always easy, especially when you’re staring down market volatility like we’ve seen recently.
Today, I’m going to take a historical look at how the market has performed during election years.
The data has its limits — but it still shows us 3 surprising ways that markets react to elections…
Presidential Election Returns Are Surprising
When thinking about elections, our perspective usually turns to whether a Republican or Democrat will win the White House.
In non-presidential cycles, that thought shifts to which party will control Congress.
For this exercise, since we don’t know who will win in November, I’ll look broadly at how the market performed no matter what.

Dating back to 1928, the average annual return of the S&P 500 during presidential election years was 11%.
Surprise No. 1: That is slightly lower than the average returns during non-presidential election years (11.6%) and all years combined (11.5%).
You might think the market ramps up during presidential election years because the policy positions of candidates become clear … giving direction to regulation and federal spending (two things that do impact the market).
But that hasn’t been the case.
You could also rationally think that returns would be higher after the frenzy around the election has settled. Again, that’s not the case…

The data concludes that S&P 500 returns were generally higher in the run-up to an election than after it. Returns after the first Tuesday of November were lower when there wasn’t a presidential election than if there was one.
This tells me the market responds to the unknown of an election right before the votes are tallied.
Market Volatility and Election Years
One thing we have seen in the market in the last few months is higher volatility.
In the last year, the market has experienced blips of higher volatility, capped by a big spike in the CBOE Volatility Index (VIX) in August.
The index peaked at nearly 38 during the first week of August but has since pared back to around 16.5 today.
But even August’s peak is low… the VIX hit 65 at the height of the COVID pandemic in March 2020.
Data tells us that volatility in the market during presidential election years doesn’t happen until closer to Election Day:

The average volatility — the standard deviation in daily returns — of the S&P 500 reached a high of 17.5% in the month prior to a presidential election.
Surprise No. 2: However, that volatility is actually higher in years when there isn’t a presidential election.
The S&P 500 experiences less volatility before and after election years compared to similar periods without an election.
Incumbency Isn’t Always An Advantage
The last data point relates to how the market performs relative to how the incumbent party does.
Currently, Democrats hold the White House and the Senate, while Republicans hold a slim majority in the House of Representatives.
So, what does the historical data tell if the party that holds the White House loses?
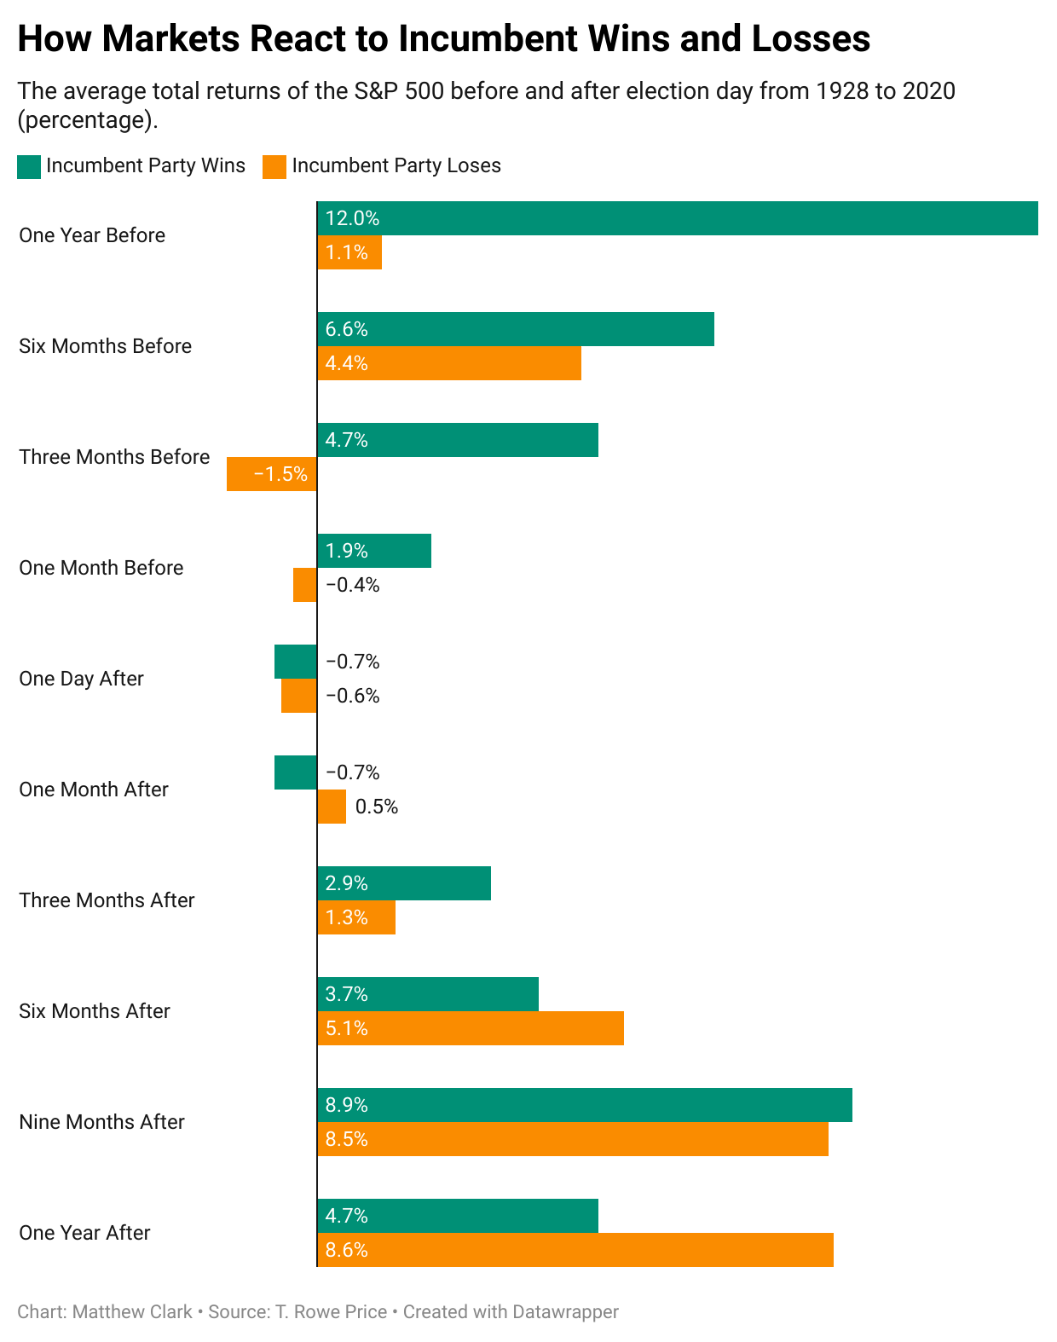
Surprise No. 3: In the time after an incumbent party wins the White House, the average returns of the S&P 500 are actually lower than if that party loses.
What It All Means: Historically, the big takeaway here is that volatility may be lower, but so are returns during presidential election years.
After the election, no matter who wins, the data suggests the market will go higher. But, how much remains the big question.
Here are a few things to keep in mind:
- Economic conditions now (think inflation, job growth and wage growth) are much different from those in previous elections.
- In addition to control of the White House, Democrats and Republicans are also vying for majorities in the House and Senate. A divided government is less likely to get major policies approved.
The important thing is to know your strategy and stick to the course, no matter how loud the election noise becomes.
Until next time…
Safe trading,

Matt Clark, CMSA®
Chief Research Analyst, Money & Markets