

More and more folks are wary of the direction of the market.
I can understand why. This bull market is in its 114th month.
We don’t see many bull markets of this length. It’s the second-longest in history.
I did a Google search to learn what the internet is saying about the topic. It is a popular topic. The truthfulness of one headline from an Indian publication struck me. It said:
Only 2 People Know the Top and Bottom of the Market: God and a Liar.
The author said timing is not important for long-term investors.
That might be. But it makes sense to think about where we are today. If you could have confidence that a market top will occur in the near future, it would help you plan.
That’s what I’m here for.
Over my more than two decades of investing, I have developed tools to gauge the status of the market. They are meant to provide high-level indications of where the market is going.
I have already shown you two of them here and here. Thus far, they suggest the market can continue to move higher.
And today, I want to tell you about another one of these…
Follow the Financials
The financials are important to the market. By financials, I mean banks, insurers, investment companies and exchanges.
They fuel its growth … and they benefit when it moves higher.
So, it is important to track how these stocks are doing.
The best way to do this is to follow the S&P 500 Financials Index.
Here’s a chart from the three years that preceded the market top in March 2009:
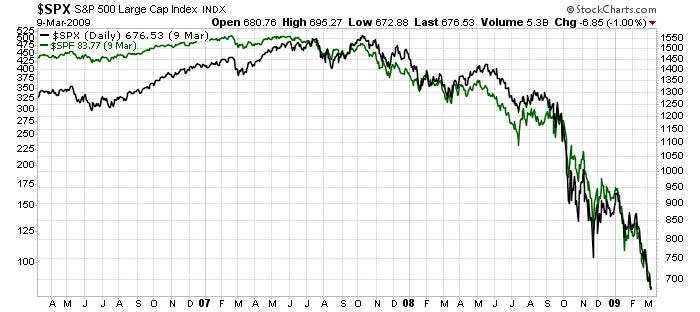
The S&P 500 Index is the black line, and the financials index is the green line.
This chart is instructive. It peaked seven and a half months before the broader market did in 2007.
They hit 509.55 on February 20, 2007. The S&P 500 didn’t peak until October, at 1,565.15.
Hindsight is 20/20, of course. It’s impossible to know they peaked the day it happened.
However, as prices trended lower after that date, we should have asked ourselves if that may have been the top.
The fact is, selling after the financials peaked in 2007 would have saved you a lot of money and angst.
By the time the broader market peaked in October, the financials were already down more than 5%.
Where Are We Now?
The financials are still moving higher today.
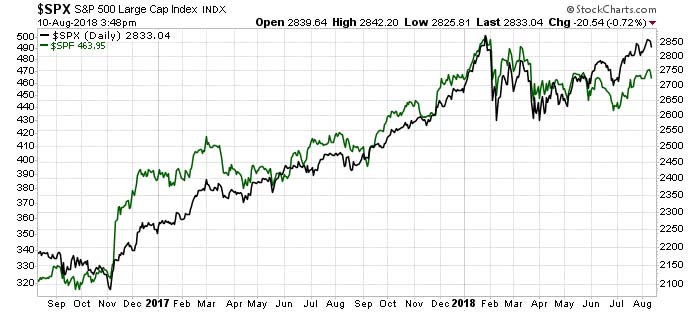
The relationship between the financials and the broader market is different than the one from the last crisis, though.
Both indices peaked on January 26 of this year … and they both remain below the high.
The S&P 500 is within 1.4% of the all-time high it set in January, but the financials are 7.5% off their high.
That said, the overall trend of each is higher. This is a good sign.
What Does This Mean?
We need to continue to watch this. The indicators from my previous two essays suggested the bull market can continue higher, but this one is a mixed signal.
We don’t know if January marked the peak. The market’s current upward trend suggests it didn’t.
However, if we see a reversal from this uptrend, I recommend you factor that into your next steps. You may not want to be as aggressive as you have been during this bull market … at least not until you can confirm another uptrend.
Good investing,

Brian Christopher
Senior Analyst, Banyan Hill Publishing