Before you rush off to buy gold, make sure you read this.
I know prices of gold kicked off the month of June in an exciting fashion — and it is tempting to get sucked into that hype.
Gold prices popped 5% in the first five days of the month. That’s a sharp swing after prices took three months to fall 5%.
Cue the “buy gold” headlines as the short-term breakout signaled a change in momentum.
However, I’m afraid we are all getting caught up with the wrong price levels in gold.
And before you rush to buy the precious metal, there’s one more level that you must keep in the back of your mind.
That’s because, even though gold had a nice move higher, its next move is likely to be a 6% drop before it rallies any meaningful amount.
Here’s why…
Resistance Level Before Gold’s August Rush
I was just as excited as the next gold bug when gold broke higher and out of its short-term consolidation pattern. But when I took a step back, I saw a bigger trend taking shape.
There was a longer-term resistance level just above where gold broke out to. The recent peak in gold prices is around $1,350 an ounce. But the resistance point is just 2% above that at $1,370 an ounce.
And this is a huge resistance level.
For reference, the more times a level is tested, and the longer it goes without share prices breaking above it, the more important the level is.
It goes back three years and it’s been tested a half-dozen times.
Since gold’s resistance level of $1,370 goes back three years, and it’s been tested six times, it is the single most important level for gold prices right now.
Assuming this key level holds one more time — and it looks like it will — gold prices can test a support level that is about 6% below current prices.
I’ve been watching gold closely. And I believe it is on the verge of a major bull market. But if you plan on holding for years, then 5% here or there isn’t a major difference.
If you play the short-term swings in the market, you’ll get a better price in the next month or so before gold prices experience an August surge.
Gold’s Bullish Seasonal Trend
We are set to enter a bullish seasonal trend for gold, but that will come after prices dip lower one more time.
Take a look at the chart below:
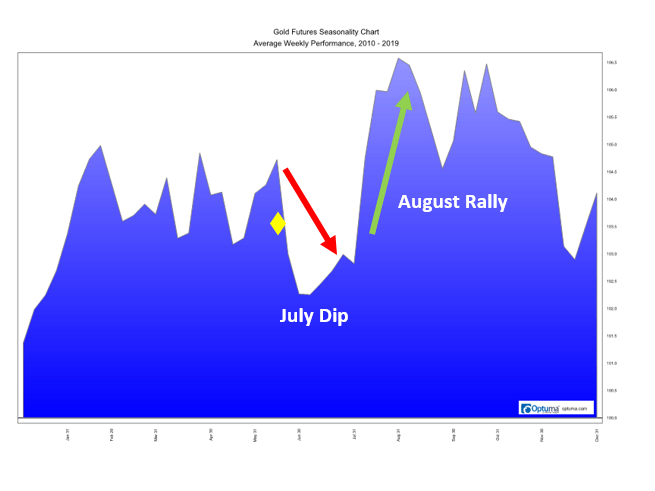
The seasonal chart shows that we can expect a short-term pullback before we get the huge and meaningful August rally. The yellow diamond shape indicates gold’s current price along its seasonal trend. The red arrow points to the dip in July, just before the surge comes in August.
This rally could be what easily helps push gold prices through that $1,370 resistance level.
And once gold can break through that resistance level, it’s off to the races. It could jump to $1,700 an ounce in just six months as this major level gives way to a rush of buyers.
To be prepared for this 24% increase, I’ll be buying gold during its coming pullback. And you can too, without having to own physical gold.
Buy GLD Before Gold’s 24% Surge
I’m a trader, so I always invest in the market with liquid assets. And there are plenty of options when it comes to trading gold prices.
One of the easiest ways to trade it is with SPDR Gold Shares (NYSE: GLD).
This is a simple fund that is set up to reflect the price movement of physical gold. It offers a cost-effective alternative to buying gold at $1,340 an ounce.
SPDR Gold Shares trades at a fraction of that. At $126.50 a share, it will get the job done and mimic the price movement in gold.
Regards,

Chad Shoop, CMT
Editor, Automatic Profits Alert