
Inflation is less than 2%. At least according to the official data.
Economic growth is the best it’s been in the 21st century. Again, according to official data.
Yet, consumers feel like they’re falling behind.
Is it their fault?
Or is there a problem with the data?
There really is a problem with the data.
To see it, let’s dig into the consumer price index (CPI), published every month by the Bureau of Labor Statistics (BLS).
1 Example of Bad Data: Inflation
The official inflation rate affects many of us.
CPI determines Social Security adjustments for millions of Americans every year. Many employers base pay raises on the data.
Minimum wages in some states change with CPI. Service providers make decisions about price increases based on inflation.
If the data is wrong, it affects all those things, and more.
Well, the data is wrong.
Among experts, the problems with the data are well-known. According to one source, the actual inflation rate is about 10% a year, not 2%.
The chart below shows inflation using rules the BLS followed before 1980. For some reason, rule changes always lower the official rate of inflation.
(Courtesy of ShadowStats.com)
Models Add Complexity and Create Errors
Real inflation is probably neither 2% nor 10%. Each estimate is based on flawed models.
The biggest problem is adjustments to the data. These are guesses about what the data should be.
Some of the adjustments correct for the time of the year. Seasonal adjustments smooth changes for gasoline, for example, because gas prices rise in the summer.
Some argue these adjustments make sense. They reflect short-term changes in supply and demand. Over time these changes even out.
Of course, that’s not the whole story.
Gasoline prices increase in the summer to comply with environmental regulations. These rules require different blends at different times of the year.
While CPI calculations assume the costs of the rules even out, they really don’t. Compliance costs rise over time. The result is ever higher prices, understated by CPI.
Over the past 25 years, Federal Reserve data shows the average price of a gallon of gas, in dollars, increased by 182%. BLS data shows a 142% increase in the official inflation index for gasoline.
That’s a relatively small difference. Just 1.6% a year, on average. But over hundreds of items, that becomes significant.
Assumptions Affect the Data
Quality-adjustment assumptions are even bigger. An example shows how much these assumptions affect the data.
New cars cost an average of $3,142 in 1967. That’s the first year we have official government data for average car prices. New cars cost an average of $36,733 today.
The BLS says car prices rose 201% over that time.
Checking the math, there’s a 1,069% change in prices over that time. BLS data understates the change in car prices by 81%.
The BLS explains the difference with hedonic quality adjustments.
They argue a car is better today than it was in 1967. That’s correct.
Seat belts became mandatory in all cars in 1968, and that was an improvement. Airbags and backup cameras came later. Better steering and brakes make driving easier.
Hedonic quality adjustments break the car down into its parts. Economists then make assumptions about each part.
For example, economists may assume better brakes added $100 to the value of a car one year. For inflation, they assume that increase away.
Those adjustments add up over time. In the case of new cars, adjustments ignore $27,275 of the current price.
Similar adjustments lower prices for clothing, appliances, electronic items and some services. Adjustments to home prices reduce the volatility of inflation data in that market.
All these changes simply ignore reality.
The Real Cost of Living
It’s true that cars are safer and more comfortable today than they were 52 years ago. It’s also true those improvements carry a cost.
To buy a car, you’re spending real money for those improvements. Inflation data just doesn’t reflect these costs. And that saves the government a lot of money.
Lower official inflation means lower annual cost of living increases for Social Security. With smaller raises, senior citizens can’t keep up with the real cost of living.
Last year, the average benefit payment increased $39 a month. With 10% inflation, a more accurate measure of the cost of living, the increase would have been $142 a month, an extra $1,236 a year.
This illustrates why the data needs to be accurate. For many seniors, the extra income would add security. That’s especially true for the nearly 15 million seniors living near the poverty line.
Economists’ Fancy Formulas
It is unlikely economic data is deliberately wrong in order to hold down costs for the government. That would require a conspiracy involving thousands of government workers. Someone would leak that news.
So, the economists aren’t liars. They’re also probably not incompetent.
Economists have physics envy.
They create models to reduce the world to numbers. This works in physics. It leads to complex math in economics.
Here are some of the formulas used to find inflation:
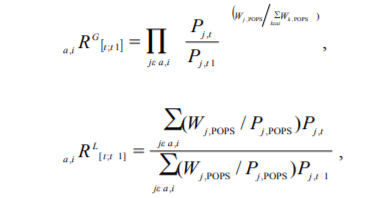
(Source: BLS)
You or I might say our monthly bills cost $3,200 this year and were $3,000 a month ago, so inflation is 6.7%.
No fancy formulas. Simply tracking monthly expenses for a group of families could provide the information.
Instead, economists build complex models and add assumptions. Similar models define gross domestic product, unemployment and other economic data. All of it is only as good as the assumptions.
While the economists are sincere, their methods are hiding the truth. We will never know what the economy is doing.
The simplest solution might be the one President Ronald Reagan explained: “Recession is when your neighbor loses his job. Depression is when you lose yours.”
Regards,

Michael Carr, CMT, CFTe
Editor, Peak Velocity Trader