
Story Highlights
- Stocks plunged more than 22% on October 19, 1987.
- Since then, investors are always wary of a pullback this time of the year.
- Chad Shoop shares one way you can profit from October’s volatility.
Last week, I attended Banyan Hill’s annual Total Wealth Symposium.
I had a great time on Amelia Island, Florida, and I always enjoy speaking with everyone who makes the trip.
This year, I received one overwhelming question: Am I worried about the stock market in October?
It’s a valid concern.
As you may recall, the market was on a strong uptrend as we headed into October last year. Then it 10% over the course of the month.
The drop in October fueled a sell-off into the end of 2018.
I’m not concerned about this October, and you shouldn’t be either. I’m going to tell you why that is and what you can expect for the rest of the year.
10-Year Seasonal S&P 500 Index Chart Shows a Bullish October
Watch my video below to learn more about what the S&P 500 Index chart says about the stock market in the months ahead.
Since October was a point of concern at our conference, I know it’s a concern many of you have as well.
Historically, October has been a volatile month.
The most notable October was in 1987. The Dow Jones Industrial Average dropped more than 22% in a single day.
Today, I’m going to show you one chart that tells us not to be concerned about October — or the rest of the year.
Take a look:
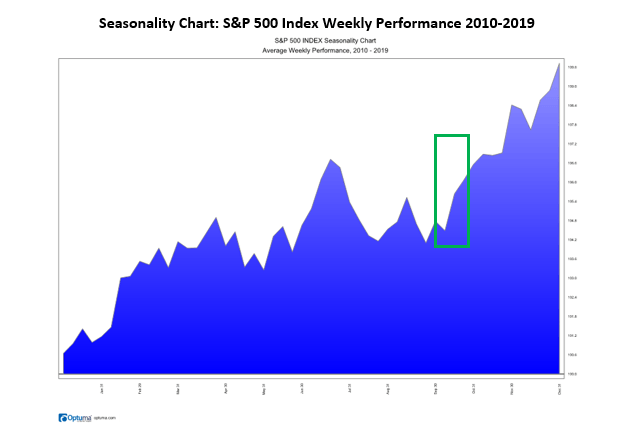
The chart shows the index’s performance for the past 10 years. The green box covers the month of October.
You can see from the upward slope that month has a bullish seasonal trend.
This tells us that despite the volatility in recent years, October is bullish for stocks.
After talking to everyone at the conference, I know investors are on alert this time around.
The contrarian in me says this is an excellent buying opportunity, and the seasonal chart confirms this view.
I’m sticking to the general trend we see for the month of October — which is a rising stock market.
On the seasonality chart, you can also see the stock market tends to finish the year strong.
The momentum that picks up during October helps propel stocks through the end of the year.
We saw a rough fourth quarter in 2018, but I don’t see a repeat of it this year. The best approach to take heading into next month is to remain bullish.
And we can take advantage of it…
Short-Term Gains During October’s Volatility
The seasonality chart shows us that even though October has batches of volatility, it is still a positive month.
That means if we get a dip, it’s a buying opportunity.
And if you want to bet on the rising market, the best way is to buy a call option on the S&P 500 Index.
A call option limits your downside risk to what you pay for the option, while giving you excellent exposure to a rally in the market.
The way to trade options on the S&P 500 is with an exchange-traded fund (ETF) designed to track it: the SPDR S&P 500 ETF (NYSE: SPY).
You can buy the January 17, 2020 SPY $299 call option for around $11.
This lets you benefit as the market rises through the end of the year.
I’ll be profiting from the rising market by picking off stocks that are set to climb higher even faster.
Click here to learn about the strategy I’ll be using.
Regards,

Chad Shoop, CMT
Editor, Quick Hit Profits
P.S. Check out my YouTube channel. Hit the subscribe button so you won’t miss any of my weekly videos.