Last Thursday’s headlines told us that the world’s fourth largest economy — Germany — had slipped into recession. German consumers were tapped out after suffering through months of high inflation.
The latest data shows the country’s inflation dropping to 7.2%. Food and electricity prices are both more than 15% higher than they were a year ago. That’s a sharp reversal for a country where inflation averaged about 1% for more than 20 years before starting to accelerate in January 2021.
Although the reasons for the recession were clear, looking back, students of history will wonder about how that period was defined. Germany is in recession because the country suffered two consecutive quarters of declines in GDP.
Here in the U.S., the question of what makes a recession wasn’t agreed on so clearly. In fact, the debate over the exact definition of a recession happened less than a year ago.
In July 2022, NPR asked if we were in a recession after the second consecutive quarter of economic contraction. Initial estimates showed GDP contracting 0.9% in the second quarter of 2022 and 1.6% in the first quarter.
White House officials, including President Biden, argued that we weren’t in a recession. They pointed to other economic indicators that showed the economy was continuing to grow.
Almost a year later, we know those officials were right. Two down quarters wasn’t proof of a recession.
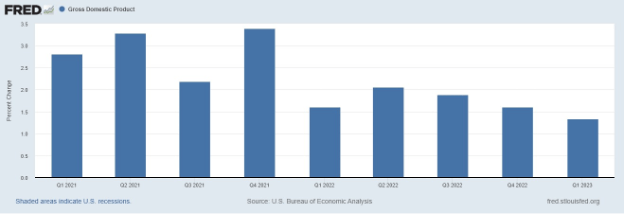
Source: Federal Reserve
What we learned last year from the debate was that recessions are defined by several indicators, as outlined below:
- Real personal income less transfers.
- Nonfarm payroll employment.
- Real personal consumption expenditures.
- Wholesale-retail sales adjusted for price changes.
- Employment as measured by the household survey.
- Industrial production.
The National Bureau of Economic Research notes: “There is no fixed rule about what measures contribute information to the process or how they are weighted in our decisions.”
Most of these indicators are at or near all-time highs and in uptrends. That’s why economists argue we aren’t in a recession.
But the problem is that the indicators can be at all-time highs when the recession begins. In fact, they often are.
Economists look for weakness in the indicators to determine when the recession started. That means the determination will always come after the recession is underway. On average, the official announcement comes eight months after the downturn begins.
Note that the table below excludes the 2020 recession because that was a unique data point.
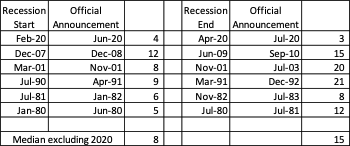
Source: NBER
This means consumers are feeling the pain of recession for months before economists and policymakers agree with them that the pain is real. Investors are also facing pain during that time.
Ignoring the 2020 recession, stocks fell during the time between the start of the recession and the announcement four out of five times. Banks stocks were among the hardest hit during that time, losing an average of 13%. The worst loss was 39% in 2008. The best case was a 6% rally in 1980.
Banks are especially vulnerable during that window. The economy is contracting. But the data doesn’t confirm it. This can lead bankers to make bad decisions.
Banks are driven by data even when they recognize a situation could end badly. This was famously summarized by Citigroup’s CEO in July 2007.
The recession hadn’t started yet then, but the housing market was already in decline. So were stocks.
According to The New York Times, the former chief executive infamously said in July 2007 (referring to the firm’s leveraged lending practices): “When the music stops, in terms of liquidity, things will be complicated. But as long as the music is playing, you’ve got to get up and dance. We’re still dancing.”
He admitted that there would be problems. But he couldn’t stop the bank from having those issues because doing so would mean sacrificing profits and potentially losing clients.
Today, banks are still dancing. History tells us that things will be complicated. And they will get uglier.
That’s why Adam O’Dell and his team are all over this. After months of monitoring the financial banking landscape, they know the worse is yet to come.
And they’ve found a way to help us prepare for what will happen when the music ends and more bank failures follow suit.
Adam went live yesterday with his list of 282 American financial stocks he thinks you should sell now … including four in particular that may be the next to go under.
Of course, it’s not enough to simply manage risk in times of rising inflation.
That’s why Adam’s also showing us how to place “off Wall Street trades” on a handful of companies that are facing major systematic risk for a chance to build wealth during the crisis.
All the details, including the four companies that may hold your deposits, are right here.
Regards, Michael CarrEditor, One Trade

What’s Happening in the Housing Market?

You might have missed it amidst the debt ceiling drama, but U.S. mortgage rates have been quietly creeping higher for weeks. The average 30-year rate is now 6.57%.
While it’s still below the 7.1% hit last November, rates have been pushing higher for most of this year, and particularly over the past six weeks.
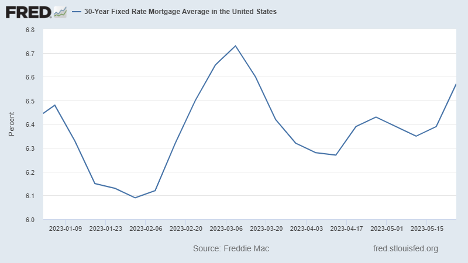
Higher rates make homes less affordable, especially for first-time buyers that may not have a lot of cash on hand for a down payment.
For example: A $500,000 house with a $450,000 mortgage at 3% would have a monthly principal and interest payment of $1,897.
That same house at today’s 6.57% rates would have a payment of $2,865. That’s nearly $1,000 more spent on just your mortgage.
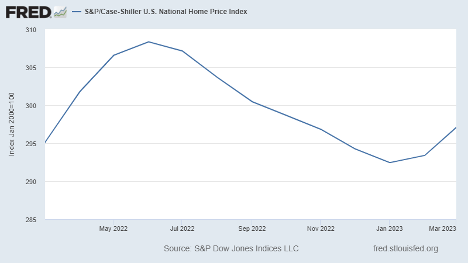
However, the damage done to home prices has been minimal … and it may be over.
The Case-Shiller Home Price Index values for March released this week. And while we’re looking at data that is close to two months old by the time it’s released, the data can still show us the general trend. Home prices rose in both February and March, after a string of declines that started in June of last year.
Certain pockets of the country are really hurting.
For example, the San Francisco housing market is in bad shape following the rush of tech layoffs over the past year. But nationwide, home prices are roughly flat over the past year, and down only a modest 3.5% from their all-time highs.
Is the decline in home prices over?
Ultimately, it may depend on whether we finally get that recession we’ve been expecting for a year now.
But given that supply remains exceptionally tight, we shouldn’t expect prices to come down too much … or at least not any time soon.
Regards, Charles SizemoreChief Editor, The Banyan Edge