

Recently, a Bauman Daily reader wrote in about my recommendation for the portfolio management service TradeStops, by TradeSmith:
Not long ago, you recommended that your readers subscribe to TradeStops, which supplies an exit strategy for one’s investments. Whenever somebody recommends an investment in a particular company, I use TradeStops to find out what they think about it. To my surprise, I find that you recommend companies which they consider “RED,” which means “get out.” How should I interpret this discrepancy between your profound analysis and your opinion of TradeStops? — Lutz D.
That’s an excellent question, Lutz. It’s an entry point to a much bigger issue … the difference between investing and trading.
Let’s start with some perspective.
The chart below shows the performance of the Russell 2000 small- and mid-cap index, which is where I tend to go fishing for investments.
The blue line shows its performance from the market bottom in March 2020 to the market top in May this year. The orange line shows the same index from this year’s market top to the present. I’ve added trendlines:
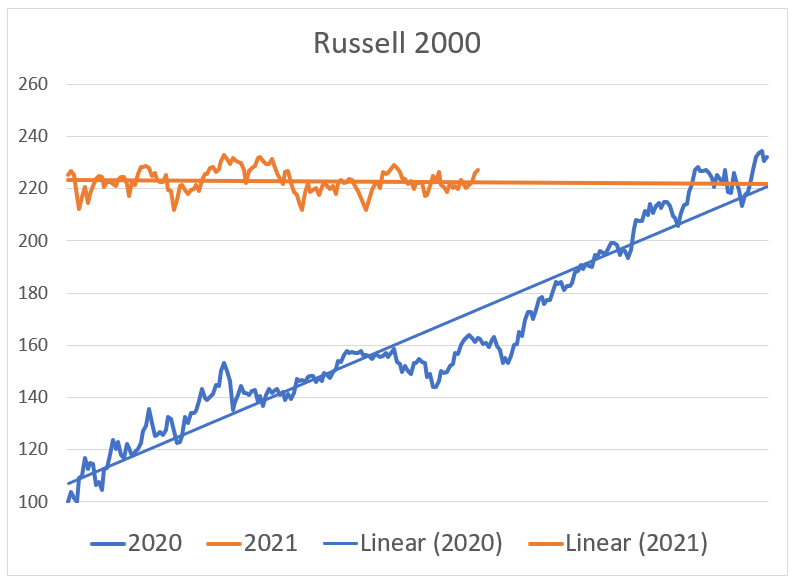
(Click here to view larger image.)
The story here is straightforward.
During the Federal Reserve-driven bull market last year and early this year, stocks rose considerably. Since then, they’ve traded sideways, if not slightly down.
The tale of these two markets provides a critical lesson in how to manage your investments … and which tool to use depending on your strategy.
Misunderstanding TradeStops
With respect, Lutz, I think you’ve misunderstood the nature and purpose of TradeStops. Let’s address those misunderstandings:
- TradeStops isn’t an exit strategy. An exit strategy is a plan to get out of investment altogether. TradeStops, on the other hand, is simply a tool that allows you to trade a long-term investment actively to maximize your gains over time. It’s not a bull or bear recommendation about a stock’s long-term prospects.
- What the colors mean. TradeStops’ color scheme tells you whether a stock’s price performance is currently in an uptrend, a downtrend or a side trend. Again, it doesn’t tell you anything about its long-term prospects.
- Red doesn’t mean “get out.” Let’s assume you have an existing investment position. In the TradeStops system, if that stock moves into “red” territory, it means if you already hold it, you might do well to sell it and wait until it resumes an uptrend. You can book the gains you’ve made, and then when the stock begins to rise again, buy it at a lower price, and make even more gains. But the TradeStops system doesn’t tell you anything about initiating a new position.
TradeStops allows you to micromanage your positions by trading them actively. It’s based on pure technical analysis, which disregards all the underlying fundamental factors that lead me to recommend a stock in the first place.
To put it another way, TradeStops doesn’t tell you which companies you should own in your portfolio. It just allows you to trade those long-term positions actively — if that’s your inclination.
When to Invest, and When to Trade
To see how something like this can work in practice, let’s revisit the chart I showed earlier.
Let’s assume you invested in the iShares Russell 2000 ETF (NYSE: IWM) at the market bottom in March last year.
Things were going along pretty well until it fell below its trendline, indicated by the red box below. At that point, you could have sold it and put the money aside.
Then, when IWM resumed its uptrend a little later (the green box), you could have bought it again, and increased your overall return:
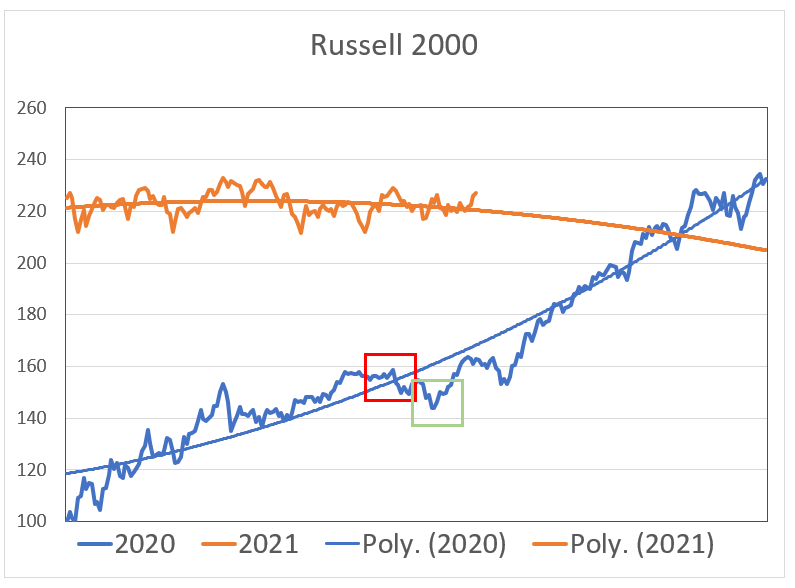
(Click here to view larger image.)
Of course, if the investment was in a taxable account, capital gains taxes might have offset the trades. But in general, if the market is in a confirmed uptrend, using the technical signals that TradeStops gives you to trade in and out of a position like this could increase your gains.
Now let’s consider 2021.
When the market is trading sideways, stocks are going to jump in and out of “green” and “red” territory constantly. You’re going to get lots of false signals … price movements based on the 24-hour financial news cycle, which could easily reverse a few days later.
Now, if you’re a day trader, that strategy can work if you have the time and energy to apply it yourself.
But if you’re a long-term investor … the investor for which I designed The Bauman Letter … these short-term price movements are irrelevant:
- For existing positions, what matters are the company’s fundamental prospects and the likelihood of long-term gains. You could use TradeStops to maximize those gains (net of taxes, of course), but for most people, it makes more sense to hold through the volatility and wait for the market to regain direction. That’s especially true if you’re following my advice to keep each individual position in your portfolio at 3% to 5% of the total.
- On the other hand, when a stock enters the red zone in TradeStops’ system, that might be exactly the time to initiate a new position. I only recommend companies that I believe have good long-term prospects. If they’re currently going through a temporary downtrend, that’s when to follow the golden rule of investing: buy low, sell high.
Options: A Trader’s Best Friend
The big picture here is that TradeStops and similar strategies are great for people who want to manage their portfolios actively. When the market is in a confirmed trend, you can use their color-coded signals to move in and out of positions to maximize your gains.
On the other hand, when the market is all over the place, as it has been this year, you can achieve even better results by using options. Instead of making small extra gains trading in and out of the actual stock, you can use options to place bets on their future movement.
That’s precisely why my partner Clint Lee focuses on that space. His first service, Flashpoint Fortunes, enjoyed an incredible run: booking 20 winning trades in a row. To date, his win rate with that service is 85%. That’s why his subscribers dubbed him “Mr. Bullseye.”
He’s developed a new strategy that has the potential to beat the market by a factor of 12 by using simple options strategies. That’s exactly what it did in our three-year back test.
He will be pulling back the curtain on this strategy on Wednesday, October 20 at 4 p.m. ET. Click here to register for free.
My advice, Lutz?
Use TradeStops the way it’s meant to be used … consider options as a short-term alternative … and watch Clint’s Profit Countdown Live event this week.
Kind regards,

Ted Bauman
Editor, The Bauman Letter


