In the past few years, we have seen some strange activity in the gold price at the end of the year.
It may have just happened again.
If so, you need to read this…
A Blow-Off Period for the Gold Price
The gold price has had a rough past few months:
It traded above $2,000 an ounce in August for the first time ever. But it couldn’t maintain its momentum.
And that’s really not a surprise, because gold tends to drop at the end of the year.
In each of the past five years, the gold price has bottomed in November or December — as early as November 12 in 2018, and as late as December 22 two years before that.
The fourth quarter has served as a blow-off period for the gold price.
Then it regroups … and rises.
And once it rises, it makes some solid moves. Take a look:

(Source: Bloomberg, internal calculations.)
There are some important takeaways to glean from this chart.
First, the gold price is on the rise.
It has traded higher each year except for one. It’s up more than 70% from its low five years ago.
Next, the gold price has risen a lot each year in the months that followed its bottom.
The max first-quarter price occurred as early as January 24 in 2018, and as late as March 10 in 2016.
This means that over the past five years, gold has risen an average of nearly 14% from its bottom. It has happened in as little as 44 days (from 2017’s bottom) and as many as 103 (from 2019’s bottom).
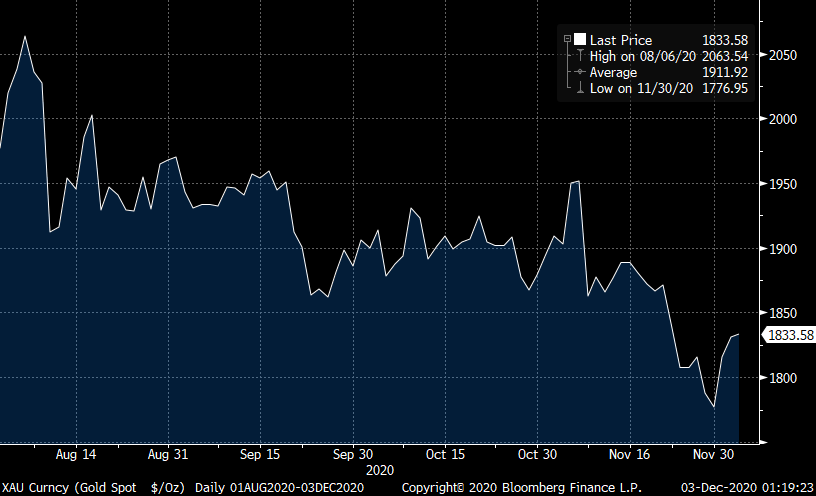
And we just observed a potential bottom in the gold price on Monday this week.
After closing below $1,800 an ounce last Friday and again on Monday, gold popped higher. It’s following the script from the past few years.
If past is protocol and this is the bottom, you should expect to see the gold price rise double digits over the next few months.
How to Ratchet up Your Returns

(Source: Bloomberg, internal calculations.)
This table shows the price of the VanEck Vectors Gold Miners ETF (NYSE: GDX). It is a leveraged way to play the increase in the gold price.
The exchange-traded fund (ETF) owns 52 of the largest gold miners and royalty plays in the world. Newmont Corp. (NYSE: NEM) is its largest position.
When the gold price increases, it normally rises more. Over the past five years, GDX has risen an average of 24% between the fourth-quarter bottom in the gold price and its subsequent peak.
Or, if you’re feeling aggressive, you could buy into junior miners:

(Source: Bloomberg, internal calculations.)
The VanEck Vectors Junior Gold Miners ETF (NYSE: GDXJ) owns more names than GDX. It has generated an average return of 28% during the last five years.
There is some overlap in the holdings with GDX. But GDXJ generates greater returns by making less-concentrated bets. It also owns some names that are smaller and more volatile.
I should also note that last year was an off year for the ETFs. Gold outperformed both GDX and GDXJ.
December Should Be a Good Month for Gold
In the past, we’ve seen gold perform well at this time of the year. Expect that to happen again this year.
Government money printing is good for the gold price. Federal Reserve Chairman Jerome Powell just confirmed this week that his group’s response to the pandemic will be to “use our tools until the danger is well and truly past.”
Powell again said this of support from Congress: “The risk of overdoing it is less than the risk of underdoing it.”
That’s good for gold.
Over the past five years, you could generate a 14% return in about three months just by going long.
And if you’re looking to add some leverage, GDX and GDXJ generally outperform the yellow metal.
Good investing,

Editor, Profit Line