
One of my stronger traits (to me, anyway) is that I know I don’t know everything.
See, if you think you already know it all, you’ll miss all the information you never knew you didn’t know. It’s kind of deep, but it’s stuck with me.
This is why I always listen first, then ask questions later.
This has enabled me to learn a lot of information over the years, and most of that has come from conversations I have had with colleagues or other professionals — not necessarily from textbooks, although I have learned a great deal from those too.
One source of information that I want to briefly share with you today is a simple calendar depicting a long-term stock market cycle.
I knew cycles existed, but I never gave it too much thought that they could really be predicted — until this calendar proved that it’s possible.
Let me explain…
A Lost Treasure
When my colleague Jeff L. Yastine joined us here at Banyan Hill Publishing, he learned that I was knee-deep in books studying for my Chartered Market Technician designation, and he said he had a calendar he wanted to share with me.
If you haven’t been introduced to Jeff, he’s a renowned TV personality from PBS’ Nightly Business Report. As great as he was as a reporter, he has an even greater knack for researching stocks.
During his time as a reporter, he did an interview once where a gentleman handed him a 100-year-old calendar as a “conversation piece.” But it became much more to him … and to me.
The calendar ended up being a doorway into the world of stock market cycles, which we used to create a new, lucrative service for our readers — Automatic Profits Alert — by identifying “seasons” in the market.
While we took the long-term calendar a step further to identify timely and much shorter-term trading strategies, the accuracy of the calendar, which is what caught our attention in the first place, still remains important.
And right now, we could be on the cusp of a sudden market decline. Here’s why…
F Is for Falling Prices
The calendar dates back to 1784 and has identified major bear and bull markets, as well as shorter-term market panics and stock market rallies.
It identifies these by a little letter beside the specific years.
For example, in 2007 to 2008 the calendar called for extremely low prices, and it expected a new stock market cycle to begin after that, which would lead to several years of rising prices. Just like the calendar predicted, the market bottomed in March of 2009 and rose rapidly for several years.
The calendar also says to expect something big in 2017 — stock market panics are likely.
It’s a year annotated by the letter F, so I went back to see how F years stacked up since 1900, and I was a bit shocked. Take a look at this chart of the previous years marked with an F and the max drawdown during those years (from highs to lows):
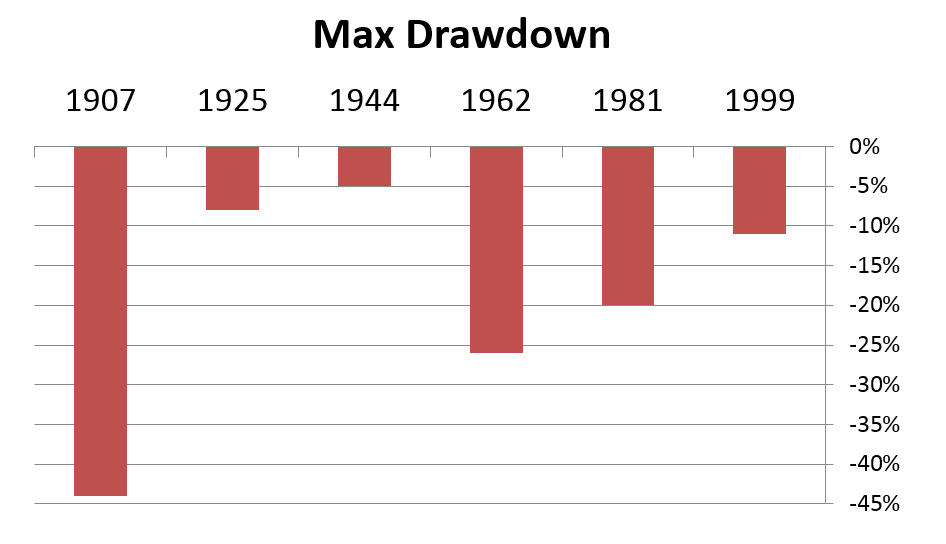
According to data based on the Dow Jones Industrial Average, each of those years suffered at least a 5% pullback.
So far in 2017 the max drawdown (the difference from the highs and lows this year) is about 3% as of Friday. So it’s likely there is some more selling pressure on the way. Maybe not immediately, but at some point this year, we can expect a more modest drawdown from 2017’s highs.
On average, F years have lost 19%.
The good news is that it’s likely to just be a correction, not a full-blown bear market like in 2008. That’s because the calendar doesn’t expect us to hit the bubble territory until the early 2020s — that’s when the next bear market is expected to fully be upon us.
So for now, signs continue to point to the bull market continuing higher, but we will be the first to alert you when those signs point to an imminent decline.
Regards,

Chad Shoop, CMT
Editor, Automatic Profits Alert