I’ve been focusing on relative strength the past few weeks.That’s “relative strength” — not the Relative Strength Index (RSI).Similar names, completely different tools.The former, I’d argue, is a far more useful tool.But to understand why, we have to understand their differences.And there’s no better place to start than with where the RSI’s name comes from…
Understanding RSI
The RSI is a standard momentum indicator. It looks at whether the price moves on up days are stronger than the price moves on down days. That’s where the “Strength Indicator” in the name comes from.RSI was designed to measure the strength of commodities, although it’s also commonly used on stocks, ETFs, and cryptocurrencies. It essentially measures the speed of price changes to spot overbought or oversold conditions.The Relative part of the name refers to the fact that the calculation forces the indicator to be between 0 and 100. That makes it possible to compare the values for different assets.Prior to RSI, popular momentum indicators weren’t confined to a range. That meant you could get a value of 0.695 for the Japanese yen and 3,085 for cocoa. Because the numbers were dictated by the asset’s price, they didn’t mean anything when compared to other assets.RSI always produces a value between 0 and 100. A reading of 60 always indicates more strength than a reading of 20.Relative Strength (RS) readings are also directly comparable to each other, and higher values always indicate more strength than lower values.But the key difference between RS and RSI is that the former is calculated by comparing the price action of one stock to another, while the latter compares former price action to current price action within one asset.
How RS Finds the Top Stocks in the Market
The stock with the highest RS is the strongest stock in the entire stock market. A stock with an RS score above 50 is stronger than the broad market. Readings below 50 indicate the stock is weaker.An RSI reading really gives you no information about what’s happening anywhere but that specific asset.The RS indicator requires a whole new way of thinking about buying and selling. Achieving above-average returns requires buying the strongest stocks. That makes bargain hunting impossible.So instead of trying to buy low and sell high, RS investors are buying high and selling higher.RS investors also won’t be able to justify holding on to losing positions for years. They can’t offer the excuse that it’s a good company and it’ll come back. If the stock isn’t among the strongest in the market, they will sell.This chart of J.C. Penney along with its RS shows that dynamic perfectly…

(Click here to view larger image.)
The beloved retailer declared bankruptcy in 2020. The stock had peaked 13 years earlier.The line at the bottom of the chart is RS. It compares the price change in the stock to the price change in the S&P 500 Index. The dashed line is at 50. The stock was a market laggard for over a decade and was avoided by long-term RS traders.Value investors argued the brand name had value, as did the real estate the stores occupied. They often believed a turnaround was imminent. After the RS fell under 50, the stock would never reach its all-time high again.In the end, the stock price fell to zero.
This is an example of how RS can help avoid losers. Of course, it also identified long-term winners.J.C. Penney gained more than 50% while its RS was above 50. When RS broke below 50, the indicator was telling traders there were better opportunities available in the market.That’s all RS does. It shows traders the best opportunities relative to all the other stocks.That’s what makes it such an essential indicator for longer-term, macro-focused traders.Regards, Michael Carr, CMT, CFTeEditor, One Trade
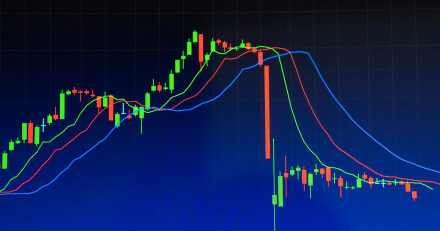
Chart of the Day:The Gold Wedge Tightens

(Click here to view larger image.)
Gold investors have… still not seen their day in the sun.We pointed out gold’s breakout about a month ago. On the back of an overhot inflation report, gold managed to break out of a yearlong downtrend. And, unlike its inflation-hedge nemesis bitcoin, it actually held on to those gains.For a while, anyway. Turns out my call for higher gold and silver prices was a dud.Gold has gotten back to its familiar game of frustrating and disappointing once again. Whether you’re a diehard gold hoarder or short-term speculator with no affinity toward the yellow metal, gold’s not been your friend.And now, we’re at a critical point. Gold is once again testing the rising white support line on the weekly chart. That’s held firm for much of the past year, but if we break below it, there’s not much stopping gold from falling all the way back to $1,600 per ounce.That said, the short- and long-term moving averages on the chart are getting quite coiled. Energy is building for a big move in either direction.Gold could surprise us with a quick upside move. But with no catalyst in sight, its failure to perform in a clearly inflationary environment, and the need for at least a 6% rally to break its downtrend, I’m leaning more bearish right now.Regards, Mike MersonManaging Editor, True Options Masters