The Journal of Economic Perspectives is an important read for investors. This journal issue showcased one of the most important charts investors will ever see.
The chart I’m talking about appeared in a paper called Anomalies The Endowment Effect, Loss Aversion, and Status Quo Bias. It’s written by Daniel Kahneman, Jack L. Knetsch and Richard H. Thaler. Nobel Prize-winning economists Kahneman and Thaler mentioned this paper in both of their citations.
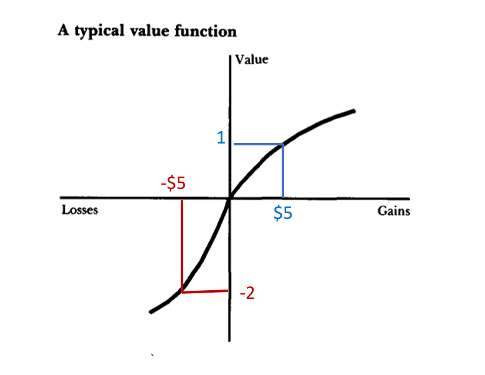
Anomalies was helpful at explaining how investors behave. Loss aversion describes why they hold losers or double down when the price of a stock they own falls. These economists in the paper wrote: “the disadvantages of a change loom larger than its advantages.” Their chart below illustrates this point.
In the original paper, the chart included just the black lines. I added red and blue below so we can better understand the message of this chart. The key point here is that losses hurt a lot.
Investors avoid taking losses because they believe the stock will recover. If it does, they’d feel worse having sold. So, they hold on. They ignore the potential advantages of a change.
Instead, they could put the capital to better use in other, more promising stocks. And they could reduce their tax bill by recognizing a loss. These are real benefits. But they prefer the status quo. It’s easier from a psychological perspective.
Pain of Loss on a Trade Is 2X Stronger Than Pleasure of a Gain
Note that the chart shows value (vertical axis) as a nebulous term. The economists defined value as an investor’s feelings about a gain or loss.
You might remember “utils” from an economics 101 class. Utils are hypothetical units measuring satisfaction.
A higher number of utils means the consumer is more satisfied. A negative number of utils indicates the consumer feels the pain of the loss. You can think of the vertical axis in the chart as utils.
The horizontal axis shows gains and losses in dollars. In this example, I added in a $5 gain and a $5 loss. The loss has a value of -2 utils. That’s twice as large as the util value of the gain.
In other words, the pain of a loss is about twice as strong as the pleasure of gains. There is detailed mathematical proof of that idea. But we don’t need to get into the weeds with that today.
Just know that many investors try to avoid taking losses because of the pain.
That chart shows why investors hold onto losers. Because selling causes pain, holding onto losers allows traders to pretend the loss isn’t real. They say things like “it’s only a paper loss” or “it’s not a loss until I sell.”
But in reality, that’s nonsense. Let’s look at one of this year’s biggest winners to understand why…
Despite 81% Decline, ARKK Investors Hung On
ARK Innovation ETF (NYSE: ARKK) gained about 60% since the beginning of 2023.
But its long-term chart below shows that this gain hasn’t helped long-term investors who bought into the bubble very much.
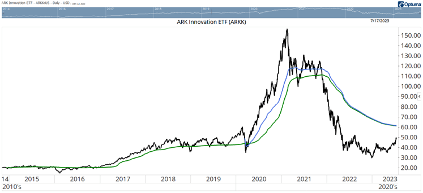
After that 60% gain, ARKK is about 68% below its all-time high. That’s a partial recovery from the 81% decline at the bottom in 2022.
Breaking even requires another 310% gain. That’s possible. But it’s unlikely.
Remember, ARKK fell more than 80% from its high. Kahneman, Thaler and other Nobel Prize-winning economists believe that market prices reflect all of the available information about a stock.
But these signals can be distorted by manias. That’s when bubbles form. Bubbles invariably lead to crashes. The crash brings prices back to where they started. The climb to new highs takes years, or decades as it is taking in Japanese stocks. Sometimes, the recovery never comes.
Since prices contain information, the 80% decline is an important one. It tells us that investors got ahead of themselves. The correct price of ARKK is between the two extremes. But it will take time to get there.
In the chart of ARKK, we can see the bubble. The crash brought the price back to where it was in June 2017, wiping out more than five years of gains.
The Average ARKK Investor Is Sitting on a Loss
Despite the losses, investors hung on. We know that because the blue line in the chart shows the average price investors paid to buy ARKK since March 2020. The green line shows the average purchase price since ARKK started trading.
If there was aggressive selling on the decline, the average price would be lower. Instead, the average investor has a loss.
The pain of accepting a loss prevented many investors from selling ARKK as the ETF plummeted more than 80%. The average long-term investor has a cost basis in ARKK of about $61.30. If prices reach that level, some will be able to sell for a gain.
We should expect to see selling pressure develop in ARKK if this rally continues. That puts a potential short-term cap on ARKK’s upside.
It’s interesting how academic research can help us understand market action to become better investors. Bottom line is that we need to accept that large market declines mean that prices were wrong. When that happens, we can hang on and sit on a loss. Or sell and use that money for better investments.
It’s always going to be hard to sell losers. But that’s what great investors do.
Regards, Michael CarrEditor, Precision Profits