Life would be different if you had a rich, generous aunt, wouldn’t it?
If you would indulge me … imagine for a moment that you do.
We have seen a stock market over the past nine years that is simply great.
Imagine that you consulted with your rich, generous aunt at the start of the period.
Doing so would have allowed you to post better-than-market returns.
I explain why below … and tell you how long this market continues in bull mode.
Using Debt to Sweeten Profits
Brokerage customers — like you and me — can incur margin debt.
When you buy stocks through a broker, you can do so using a cash account or a margin account.
A cash account is what it sounds like. You buy stocks using the cash in your account.
If you buy using a margin account, your broker funds a portion of the investment. The portion you pay is known as the margin. The portion the broker pays is margin debt.
You can amplify your cash returns using margin debt.
Let’s think about it with an example. If you buy $1,000 of stock and it grows 13% per year for nine years, you will have $3,000 by the end of the ninth year … $3,004 to be exact.
Remember your rich aunt? She’s so sweet. Let’s call her Aunt Judy.
Pretend you only put up $200 (20%) of the initial investment … and Aunt Judy funds the rest. She tells you: “Don’t worry about it, honey. Just pay me back at some point.”
Instead of having a $2,004 profit, you would have much more. We know your original $1,000 investment is now worth $3,004. But you only funded 20% of that!
You could have invested the other $800 as well (from your original $1,000). That $800 investment is now worth $2,403.
You now have a total of $5,407. Once you reimburse the $800 you borrowed from Aunt Judy, you still have $4,607. That’s a $3,607 profit. Pretty slick. You only would have had a $2,004 profit if you fronted the whole investment yourself.
That’s how margin debt works.
If the brokerage funds a portion of your original purchase and the investment you make goes up in value, everyone wins.
Of course, the brokerage charges you some interest for the loan. It is, after all, not your sweet Aunt Judy.
But it doesn’t cost as much as your profits.
You still end up ahead during a nine-year bull market.
What Is Driving This Market Higher?
By the way, I used the 13% return on purpose.
You see, the S&P 500 Index increased 13.2% (before dividends) on average every year from the end of 2008 through 2017.
Using margin debt to invest in the market was smart over this stretch. It allowed investors to amplify their returns.
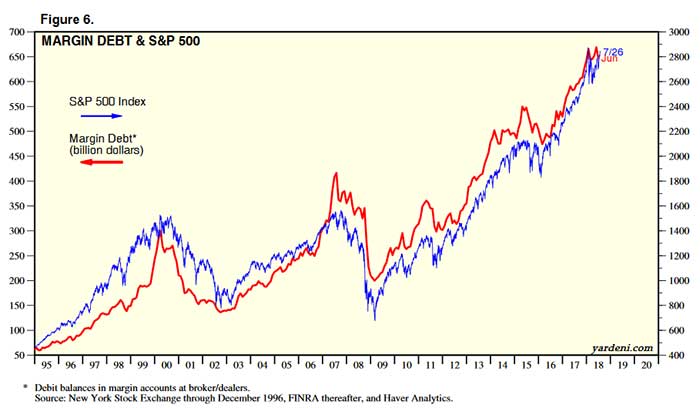
Many have been using it. Since bottoming in 2009, margin debt has more than tripled:

(Source: Yardeni Research)
As you can see, the market went up with it.
The two metrics are positively correlated. They tend to move in the same direction.
What Does This Tell Us About the Direction of the Market?
As we assess where the market is going next, margin debt is a useful tool. The market and margin debt continue to move higher today … though that will reverse at some point.
Returning to the last crisis shows why. Margin debt peaked in July 2007. The S&P 500 didn’t peak until early October of that year.
This year, margin debt posted its two highest readings ever in May and January (in that order).
Overall, both continue to post higher highs. We can see above that these numbers tend to move together.
Both are trending higher today … and this bull market will continue. If margin debt drops for several months in a row, it will be a different story … but we’re not there yet.
I told you about another indicator, the cumulative advance-decline line (ADL), in a recent essay. I’ll continue to watch margin debt and the ADL to assess where the market is today.
In the future, I will present other metrics as well.
Good investing,

Brian Christopher
Senior Analyst, Banyan Hill Publishing


