
Interest-rate trends last for years.
That’s good. Long trends allow businesses to plan. Consumers make decisions on large purchases with confidence.
But the long-term trend just shifted. And that’s not good for businesses, consumers or stocks.
The chart below shows the shift in interest rates. At the top is the yield on 10-year U.S. Treasury notes. The 10-year rate of change (ROC) is at the bottom of the chart.
It just turned up, ending a 28.9-year trend.
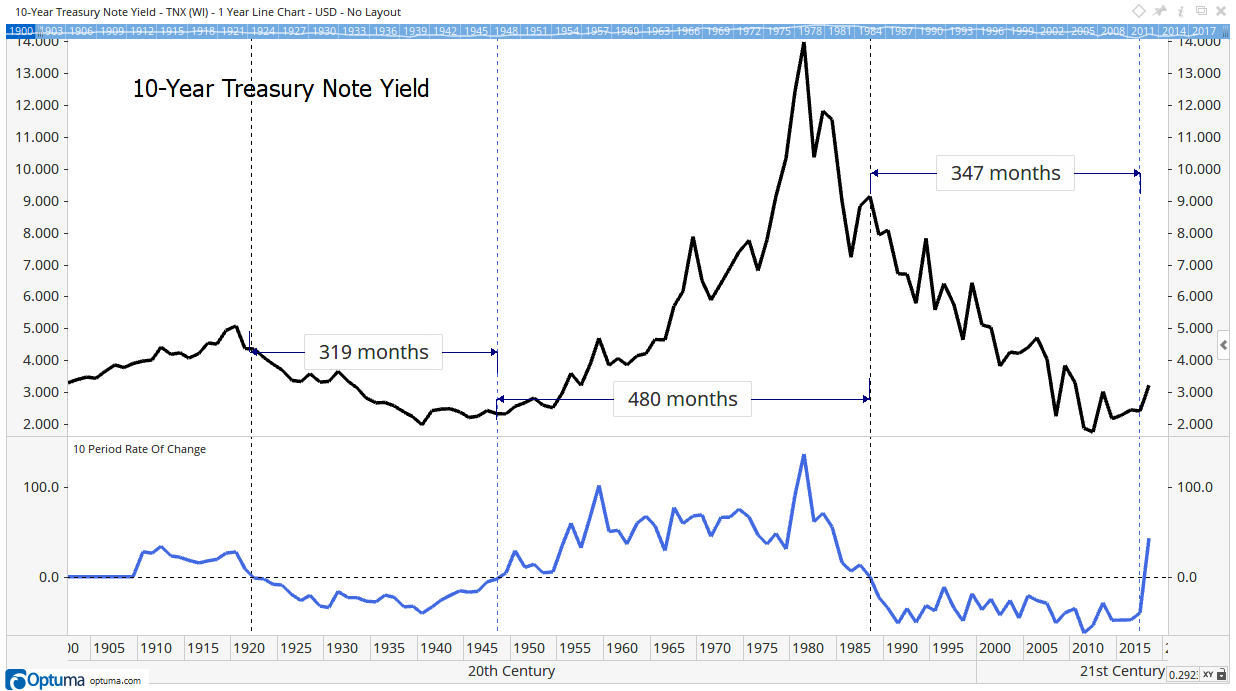
ROC smooths the trend. It ignores short-term changes. Focused solely on the long term, ROC shifts slowly.
This is just the second time in 108 years that the ROC shifted from negative to positive. After the first change, in 1948, interest rates rose from 2.3% to as high as 15.8%.
Now, the interest rate on 10-year Treasurys is 3.2%, and that rate is rising.
History says we should expect this trend to continue for at least the next 25 years. On average, the three cycles in the chart lasted almost 32 years. The shortest was more than 26 years.
The direction of this trend is important news for investors.
Average long-term returns of the stock market were below average from the end of World War II until the interest-rate trend reversed in 1988. Home prices moved in line with inflation over that time.
Neither asset class delivered strong results. And bond prices dropped as rates rose. Overall, it was a challenge for investors to build wealth.
That could be because interest rates rose so much. Honestly, if you could lock in 8% for 10 years with no risk of loss, would you?
That’s a question investors will face again. Many will buy bonds as soon as they offer sufficient income.
That factor alone explains below-average gains in stocks and homes. And that’s what the next 25 years could look like.
Regards,

Michael Carr, CMT, CFTe
Editor, Peak Velocity Trader