
When developing trading strategies, I start with a nine-word philosophy. It’s a simple but powerful one: “To know what everyone knows is to know nothing.”
That means that you can’t get rich using tools everyone knows about. Value investors need more than price-to-earnings ratios. Technical analysts need more than indicators that are available for free.
You see, traders can’t just rely on something such as the Relative Strength Index (RSI) to be profitable. Although this is one of the most popular technical indicators, it rarely offers trading signals. And when it does, these are often wrong.
What many investors don’t know is that a tweak to the RSI can provide timely buy and sell signals.
In fact, this tweak provided a signal this month.
Hacking RSI to Profit
RSI is defined so that the value is always between 0 and 100. The indicator gives buy signals when it rises above 30. A sell signal occurs when RSI falls below 70.
The chart below shows one of the problems with the traditional RSI indicator (RSI is in the middle of the chart):
Traditional RSI vs. Derivative Oscillator
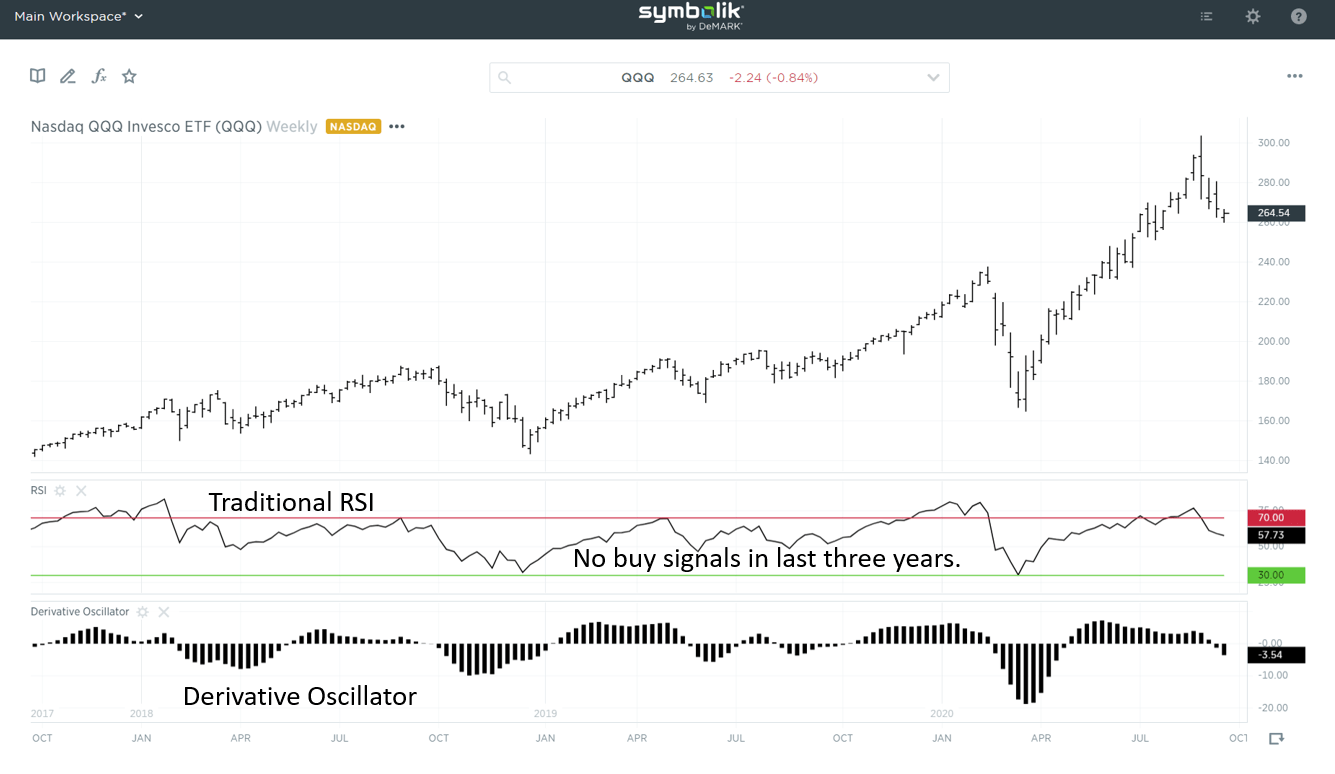
(Source: Symbolik)
For the Invesco QQQ Trust (Nasdaq: QQQ), RSI just gave a sell signal. Unfortunately, the indicator gave no signal in over three years.
At the bottom of the chart, the Derivative Oscillator (DO) also provided a recent sell signal. That reverses a buy signal it gave in April, close to QQQ’s bottom.
In fact, DO has repeatedly given buy signals and sell signals. Many of the signals come as the price trend is reversing.
DO is timelier and more consistent than RSI even though it is derived from RSI. It’s calculated using RSI in the formula to find MACD, another popular technical indicator.
Like MACD, DO is designed to move above and below zero. Buy signals are given when the indicator moves above zero. Sell signals occur when the indicator turns negative.
Signals are clear, and as the chart shows, they are often useful. Prior sell signals came before price declines or trading ranges.
Over the past three years, moving to cash when DO turned bearish beat buy-and-hold returns.
But using a derivative of RSI to enhance performance is only a part of the solution. For an opportunity to see substantial profits, smart investors will need to pair this approach with options.
Amplify Gains With Options
Put options allow traders to benefit from price declines. With this strategy, risks are limited and potential gains are large.
As an example, for QQQ, a put option expiring in November with an exercise price of $250 costs about $1,000. If QQQ falls 15%, this option would be worth more than $2,500.
The risk is limited to the cost of the option, or $1,000 in this example. The potential return is 150% of the amount risked if QQQ falls 15%. Gains could be larger if QQQ falls more than that.
Using the Derivative Oscillator with options instead of just the traditional RSI indicator is an overlooked tactic by average investors.
(To learn about my simple but powerful One Trade options strategy, click here.)
So for those willing to take it just a step further, this tool can reward traders with potential profits unseen by most.
Regards,
Editor, One Trade