
It’s great fodder for mainstream news outlets.
An analyst on Wall Street upgrades or downgrades a stock.
If you are on the same side as the analyst, it’s great news.
But, when you are on the wrong side, you can easily see the reason behind the downgrade doesn’t mean squat.
Wall Street analysts get paid to cover stocks. But they’re not fortune tellers.
They work at desks in corporate offices. If their prediction is wrong — if the stock goes against their predictions, whether it’s higher or lower — they get bosses breathing down their necks just like the rest of us. Then, they issue a new prediction about where the stock is headed.
We are not Wall Street analysts here. Our goal is simple. To make you money.
And our paychecks are not tied to any firm on Wall Street, so we are free to follow the real data to profit from where a stock is headed.
Today, I’ll break down the recent analyst downgrade on Micron Technology Inc. (Nasdaq: MU), a major tech company. And I’ll show you how the analyst has simply got it wrong this time.
Before we get into the analyst downgrade, I recorded a new Bank It or Tank It video on Micron.
The company is a popular stock in the semiconductor sector thanks to the growth of the tech industry. In my video, I determine if this is a stock you want to bank on going higher or if it is set to tank and go lower.
Watch my latest video here…
This week’s Bank It or Tank It features a well-known semiconductor stock, Micron Technology (Nasdaq: MU).
For each company we break down, we take a wide approach by looking at the fundamentals, the sentiment and the technicals to figure out if this is a stock that we want to bank on going higher over the next 12 months or if this is a stock that’s going to tank and head lower.
But we take a data-driven approach…
Micron is a popular tech stock because of the devices its products go into. It’s everything from computers and smartphones, to virtual reality and self-driving cars. All these technologies rely on insanely fast signals between all of their components. Micron makes the memory chips that make all of that possible.
So while the company benefits from the global tech revolution, it’s not trying to make a self-driving car.
Instead, Micron’s chips are the guts inside the tech that goes into the car, which will help allow major advances in technology.
That makes Micron much less of a risk than the company making the self-driving car. Micron isn’t inventing a whole new technology with its business. It is just creating the parts that will go into these revolutions. And Micron will still benefit as that new technology becomes more widespread.
As 5G speeds are rolled out across the country, these devices will need even more memory. The computer processes can simply do more with faster internet speeds. But they will need even more powerful memory chips installed to keep up. That’s why semiconductor stocks see ever-growing demand. Every few years, the devices their chips go in need total upgrades. That means more sales for Micron over the coming years
Let’s get started by looking at the fundamentals for Micron to see how its revenues and income stack up.
The Fundamentals
Revenues are the blue bars on the chart (on the right-hand side); and net income is the line on the chart (on the left-hand side):
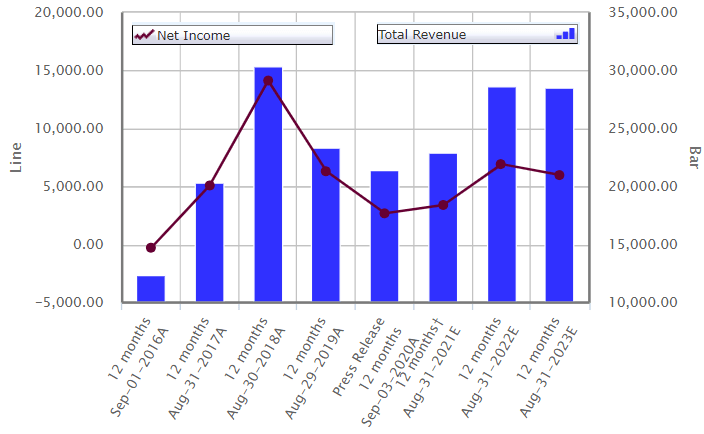
Now, when you look at net income, it starts just below 0 but climbs in 2017 and 2018. In 2019, it lost some of its net income — the bottom line for its earnings. And in 2020, its actual earnings continue to drop from there.
Now, we all know what’s happened over the past several months. Even though chip stocks are still in demand, by what we’re looking at, 2021 earnings expectations are probably going to be questionable, at the very least. It’s going to be tough to see how Micron can continue to grow in the type of market environment we’ve had. There’s a lot of uncertainty that’s going to slow down demand.
But once we get through this, I believe that this is a company that can make this sort of rebound that they’re showing here for its net income to grow over the next couple of years.
Even for total revenues, the blue bars, we see they have all been declining for Micron Technology in 2018, 2019 and 2020.
Revenues peaked in 2018, but the projections are showing a nice turnaround for the company.
And based on all the technological shifts that are going on in the world today, this is a company in an industry where I believe this is possible. I normally don’t like to see the expectations being the reason that we’re trying to turn around our view on the stock, but with a company like Micron, it’s definitely within grasp for the company to turn the ship around and continue to improve.
Breaking Down the Competition – Size, Shorts and Earnings
Now, let’s take a look at some of its competitors in the industry. These are stocks pulled right out of the semiconductor sector. You can see that Micron (at the bottom) has a market cap at about $55 billion compared to the average of these companies — $123 billion.
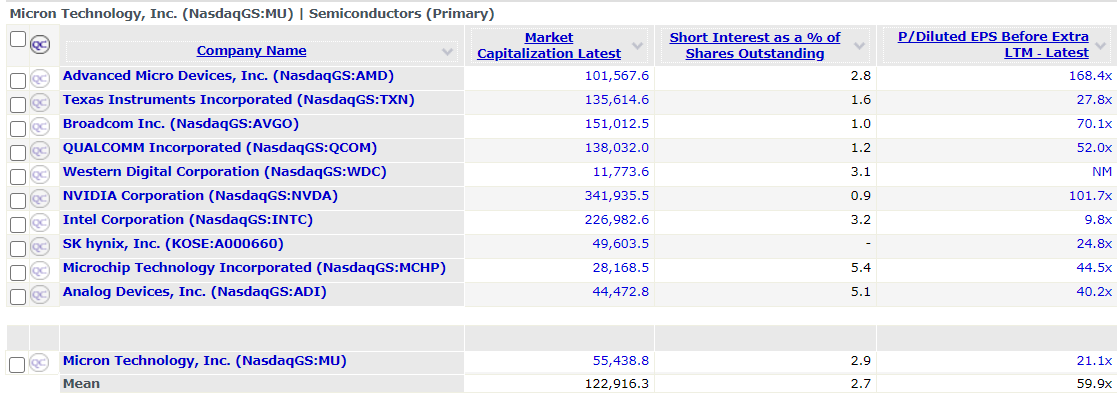
Micron is a relatively small semiconductor stock, especially when compared to companies like Texas Instruments (Nasdaq: TXN) at $135 billion, NVIDIA (Nasdaq: NVDA) at $342 billion and Intel (Nasdaq: INTC) at $227 billion.
Micron, at just $55 billion, has a lot of room to grow, with plenty of market share it can still capture, that will help turn around its revenues and net income.
We see short interest as a percent of the shares outstanding, where we just want a feel for the negative sentiment in the markets. Short interest is gauging the number of people selling these shares short, expecting the stock to go down.
At 2.9% for Micron Technology, it’s right with the mean of the rest of the companies on this list. So this is nothing to worry about for Micron.
The price-to-earnings ratio is at 21 times earnings. And when you look at the industry here, it’s nearly 60 times.
Even though net income has declined over the last three years, you can see that its price-to-earnings ratio is still very well within reason, and some would consider it a deep value play at this point.
You can see from the chart above that Advanced Micro Devices, another hot semiconductor stock, is trading at a sky-high 168 times earnings. Even Broadcom (Nasdaq: AVGO) trades at 70 times earnings, and NVIDIA, one of the largest semiconductor stocks, trades at more than 100 times earnings.
So when you look at Micron, at 21 times earnings, it’s screaming that it’s extremely undervalued.
There could always be something going on behind the scenes, but on the surface, Micron definitely looks like a great stock from a valuation perspective.
Breaking Down the Competition – Revenue Growth, Income Growth and Yields
When we look at the average compound annual growth rate (CAGR) for revenues and net income over the last three years, again, Micron’s weaker revenues and income from earlier are starting to show up.
Total revenues is just 1.8% growth compared to a mean of 7%; and net income is nearly a 20% decline for the bottom line compared to just around 13% for the rest.
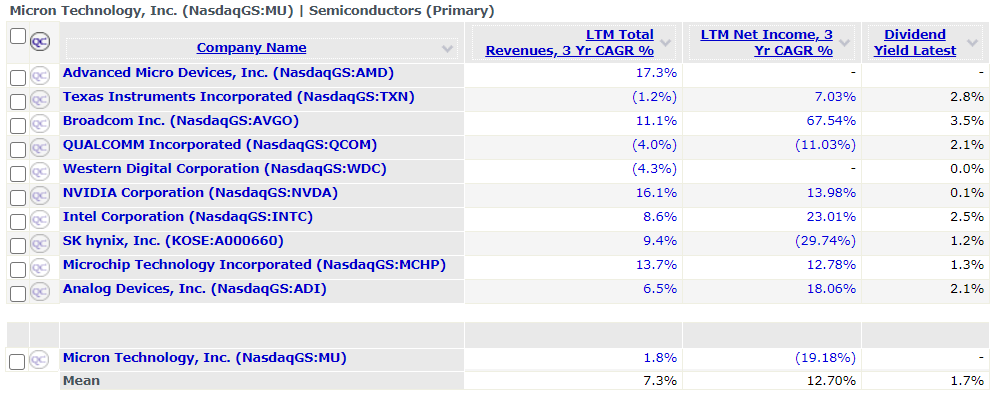
Our net income and revenues chart earlier showed that these numbers would be weak, and this just puts it in perspective with the rest of the industry. Numbers like these are probably why MU has such a cheap price-to-earnings ratio, as well. And that’s a little alarming.
We know it’s going to get worse, at least in the short-term, before it gets better. It’ll take time to turn around from here.
The last item I wanted to look at with Micron’s competitors was the dividend yield. It gives us an idea of how some of these other companies are willing to spend their cash, giving it back to investors via dividend.
The average yield is 1.7%. The only other companies that don’t pay a yield other than Micron is Advanced Micro Devices and Western Digital (Nasdaq: WDC). These stocks are very similar in nature, but some of these other smaller cap stocks, like Microchip Technology (Nasdaq: MCHP) and Analog Devices (Nasdaq: ADI), still pay out a small dividend.
Once you get to the size of Texas Instruments, those are the large-cap stocks that you would expect to pay out larger dividends.
Micron not paying a dividend doesn’t concern me at all, because it’s in the growth phase. And for most companies, when they’re in this phase of the cycle, I’d rather them spend their money on more investments and more exposure to the industry, for continued to growth.
Analyst Recommendation
Now, I always like to take a look at what the analyst community has rated the company, just to get its take.
With S&P Capital IQ, we have 31 total analysts covering the stock. Their rating for MU is 1.73.

That’s an outperform, on a scale of 1 being a strong buy and 5 being a strong sell. The analyst community sees what’s going on with Micron, is very bullish, and it says MU is a buy.
The Technicals
Now, our technicals segment is where we take a look at the price chart to see what to expect next from the stock. This shows the stock’s full price history:
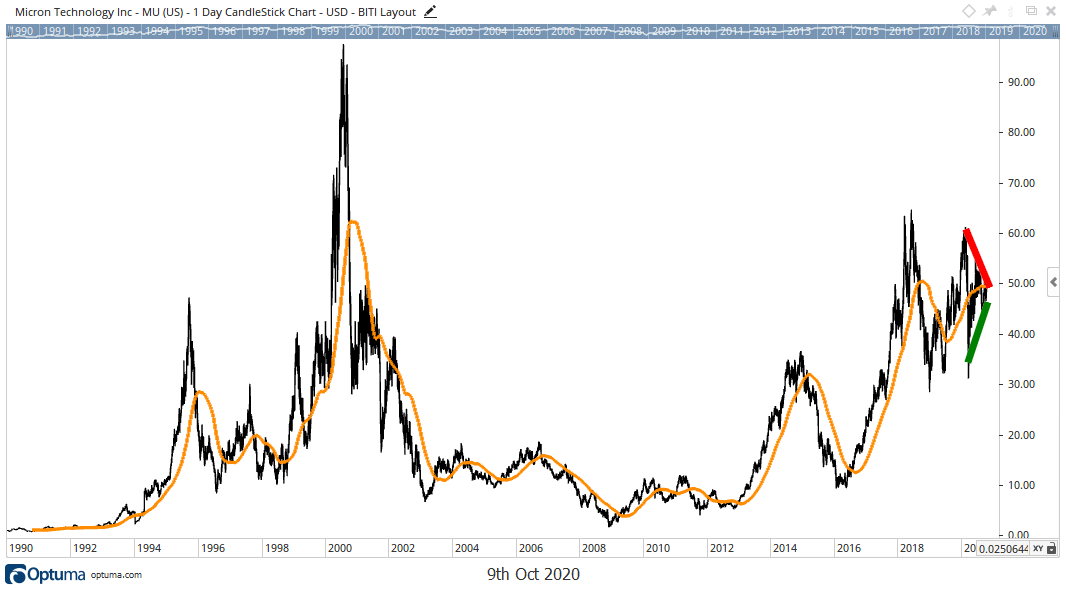
It goes all the way back to 1995, when it first came out into the market. What I really want to point out is the market hysteria that sparked a massive rebound rally after the coronavirus-related sell-off.
There’s no doubt we have a ton of uncertainty. But when you look at Micron Technology, a major semiconductor company in an explosive industry, it’s going to continue to find sales, grow for years and, ultimately, benefit.
When you look back at the dot-com bubble back in the early 2000s, this stock was priced at more than $90 a share, and then it came collapsing back down. It’s just a remarkable contrast to where we’re at today.
Micron shot up from around $10 a share in 1998 to more than $90 a share in 2000 — absolutely phenomenal returns in just two years, if you were able to make that trade.
A massive rally from the low $30s back up to the $50s in only a month seems like a big deal. But we’re nowhere near the same levels we saw back in the dot-com bubble, which likely means that we’re not in a massive bubble today.
We’re in a price discovery phase for the entire market. Are we going to have to shut down again? Are we going to continue to grow?
For Micron, it’s not going to be that big of a factor, because it’s in these major industries that are still thriving. It’s really not a worry for the stock, but here are the few key levels to watch here:
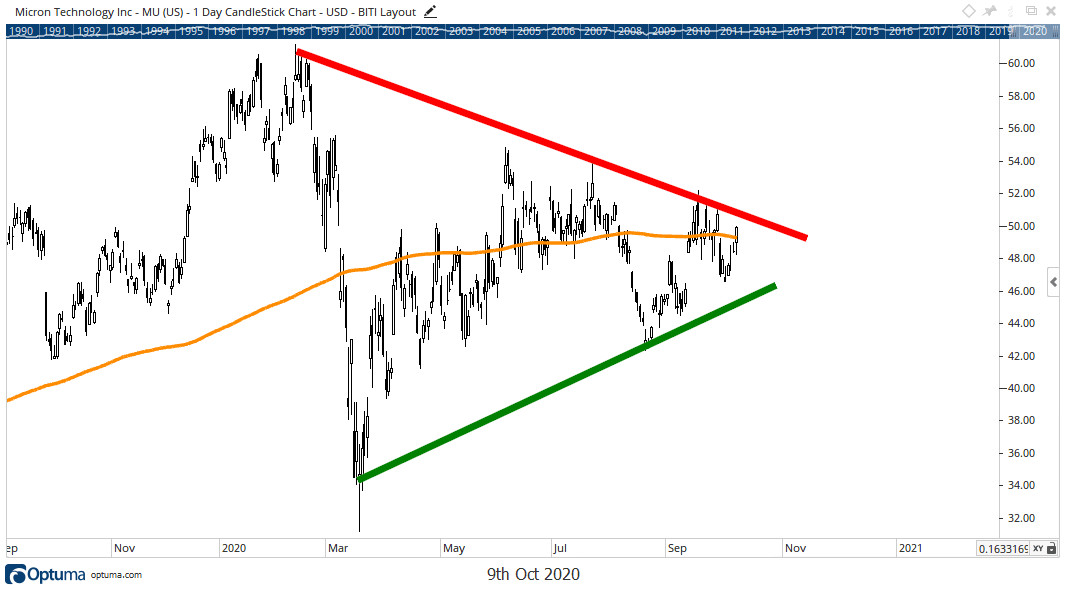
There are two major trend lines I want to point out that, when combined, create a wedge pattern setting up for a breakout in Micron.
First, notice the yellow line in the middle of the chart. This is the 200-day simple moving average. I use it as a sentiment indicator as well as a trend indicator. And right now, it isn’t telling us much of anything. We know the stock is stuck in a consolidation period. So, until it breaks out, the 200-day moving average won’t help us much.
We’ll keep an eye on the declining resistance level in red and rising support line in green. Those are the two key levels that will signal a breakout is coming for the stock, once they’re broken.
Keep in mind, consolidation periods like this are not necessarily a bad sign. Stocks don’t go straight up all the time. Breaks like this are great to fuel more buying pressure into the stock as investors look to build bigger positions.
And that very well may be the case for Micron today.
Let’s recap by taking a look at my checklist to see how the stock stacked…
A Look at the Checklist
When we looked at the fundamentals, the company had some nice earnings and revenue growth. But those numbers were for future years that remain uncertain. We looked at Micron’s annual revenue and net income chart, and the stock peaked for revenues and net income two years ago.
The expectations are for a massive turnaround for the company. And even though it’s in a great industry and has explosive growth opportunities, until it shows us something, this is going to get an “X” mark for the fundamentals.
When we looked at sentiment, the analyst ratings were bullish. They’re hyped up. The stock is rated at 1.73, so the analyst community is on board. But the 200-day moving average is not really giving us any clear trend for the stock price.
I wanted to see both the ratings and moving average confirm a bullish sentiment and they didn’t. So we’re going to give sentiment an “X” today, too.
When we looked at the technicals, we have a stock in a consolidation pattern, as the price chart shows a wedge formation. Over the next few weeks, we’ll get a breakout from this and will have a clear path from there. Until we get that clear uptrend in place and we break out of this wedge pattern, I’m going to have to give it an “X” at the moment.
That means that Micron Technology is going to end up on our Tank It list.
And I don’t say this lightly because Micron, as I went through this, is a stock that I really like. I like the story for the semiconductor industry, I like what it’s doing to position for the future and I like the growth opportunities that the industry represents.
But when you look at the fundamentals, the sentiment, the technicals, the three things that we follow here for our Bank It or Tank It analysis, it’s not matching up.
The company just hasn’t done the right things that it needs to do to continue to head higher. So Micron Technology is on our Tank It list for now.
So why did the company just get a downgrade?
Seasonal Trends
An analyst at Wedbush Securities, an investment firm, recently downgraded the stock due to what it called “seasonal weakness.”
But they have it all wrong.
While Wall Street analysts are great at breaking down balance sheets, they don’t have a good track record of predicting stock price movements.
That’s because they have hidden agendas in their corporations to upgrade and downgrade the stocks they cover.
The bottom line is that analyst expectations aren’t leading indicators for price movement.
Case in point is the seasonal weakness the analyst mentions. They expect the stock to experience weakness heading into the end of the year due to a slowdown in sales.
The analyst may be right. Chip sales may decline near the end of the year. It makes sense as tech companies focus on a holiday sales push, instead of creating new devices.
But if you take a look at the actual industry, a seasonal decline in the stock at the end of the year is just not likely.
Take a look at the 10-year seasonal trend for the semiconductor sector:
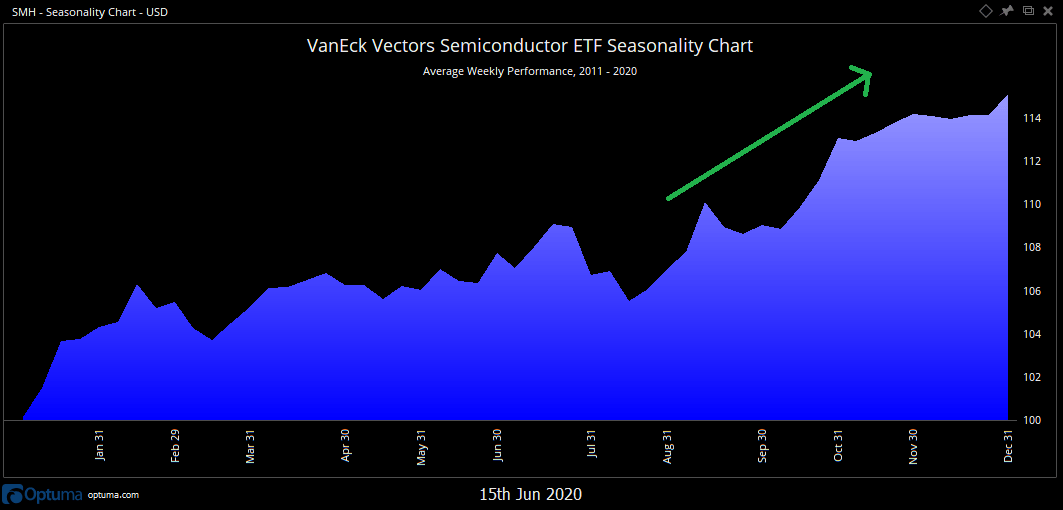
This chart combines price moves for the past 10 years. They’re averaged and arranged to show the stock’s trends during specific times of the year. We use charts like this to show us the seasonal trends for specific sectors of the market.
This chart is showing us an exchange-traded fund (ETF), VanEck Vectors Semiconductor ETF (Nasdaq: SMH). SMH tracks the semiconductor sector. In the blue shaded area, you’ll see that semiconductors tend to bottom in late August, then steadily climb through the end of the year.
I don’t pay a lot of attention to investment firm analysts. It’s for reasons like this.
They’re more interested in looking like they are paying attention, than actually paying attention.
I take a different approach. I look at data and real-world trends. I’ve developed an approach using these trends, where we can enter individual stocks throughout the year, down to the day the seasonal trend begins. Click here to find out more about this strategy now.
Following the analyst recommendations on a stock is like trading on old news. I want to know where the stock is going in the future, and seasonal trends are a phenomenal predictor of that.
Regards,

Chad Shoop, CMT
Editor, Automatic Profits Alert
P.S. Tesla stock also received a recent downgrade and Chad thinks this is simple price manipulation by Wall Street analysts. Check out his thoughts on Tesla Inc. (Nasdaq: TSLA) over on Money & Markets.