
On February 5, I predicted gold would head higher…
It wasn’t a popular prediction.
The metal was hitting its prior highs near $2,135 per ounce but failing to break through.
If you were just looking at the chart, you may have thought that it was about to break lower instead.
However, the breakout I expected happened:
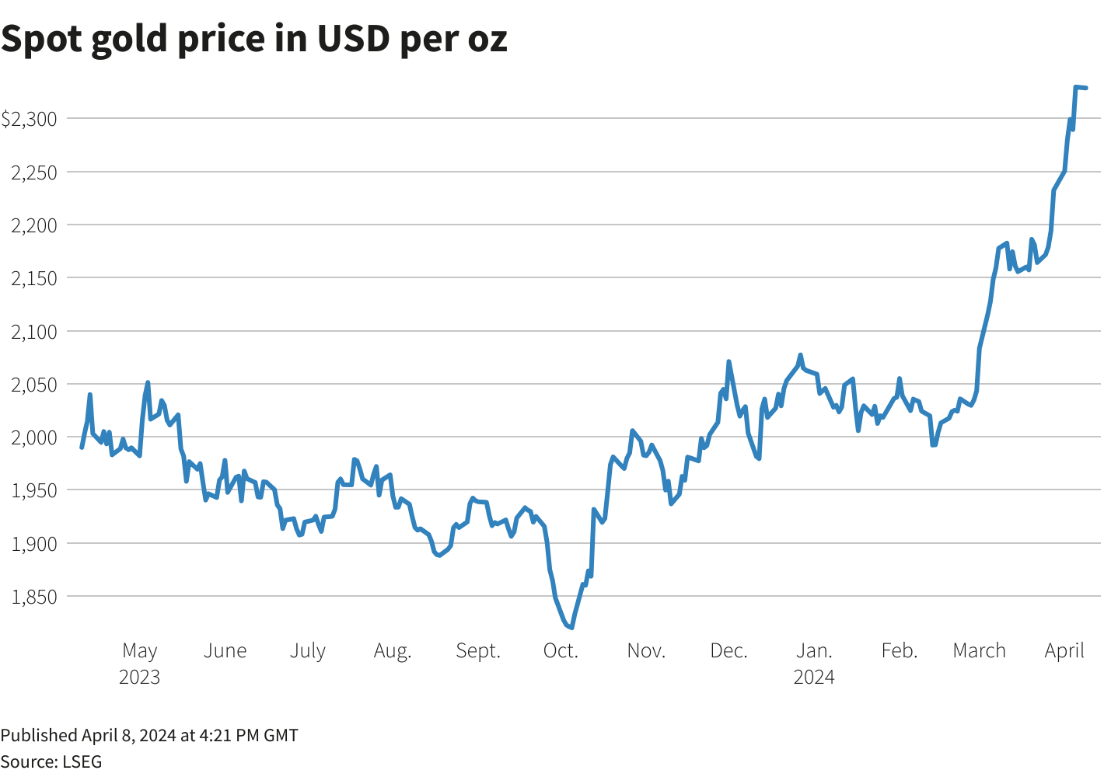
After getting to that $2,150 point, prices flatlined for a moment before continuing higher.
The metal topped $2,400 in trading last week amid rising global fears.
Today, prices are pausing again, but the uptrend is clear.
Gold was already beating the stock market this year before it pulled back. Now, gold’s outperformance truly shines.
With this breakout in mind, I want to revisit my prediction and see how the factors behind that prediction are playing out.
Fair warning: I do not think we will ever see gold this cheap again.
Now that the metal has broken higher, I expect it to keep going higher.
The good news? It’s not too late to hedge your portfolio with gold.
And there’s better news…
Because of how this prediction is playing out, I see several other related opportunities ahead in the commodity space.
The Trends that Moved (and Will Move) Gold Higher
Back in February, I saw gold trending higher for several reasons.
No. 1 on my list?
Global tensions.
As I noted at the time: “Unfortunately, we seem to be inching toward more global violence, not less.”
That was before Iran directly attacked Israel with a fleet of drones and ballistic missiles. And Israel’s response on Friday.
Meanwhile, Russia has entered its third year of war with Ukraine.
America and Europe are uniting behind Ukraine. Russia is deepening ties with China, which is still inching toward a potential invasion of Taiwan.
In short, the lines are drawn for a potential global conflict. And the powers involved control thousands of nuclear weapons.
I wish these trends weren’t at play. Because they are, it makes sense to be a gold buyer here for safety.
But that’s not the only reason.
In February, I pointed out that the federal debt continued to grow.
The U.S. debt clock topped $34.6 trillion.
For a country that isn’t at war (yet) or in a recession (yet), Congress has continued to run annual deficits of over $1 trillion.
That’s like stepping on the economy’s gas pedal — fueling inflation.
Even though the Federal Reserve speedily raised interest rates from 0% to 5.25% in under 18 months, inflation looks sticky.
From a peak of over 9%, inflation’s latest read was 3.5%. That’s nearly double the Fed’s target of 2%.
However, the Fed can only tap the brakes so hard when Congress is stepping on the gas.
Frankly, the likely outcome from all this is stagflation, the combination of a stagnant economy with high inflation.
In fact, you may have seen some charts like this one in recent months:
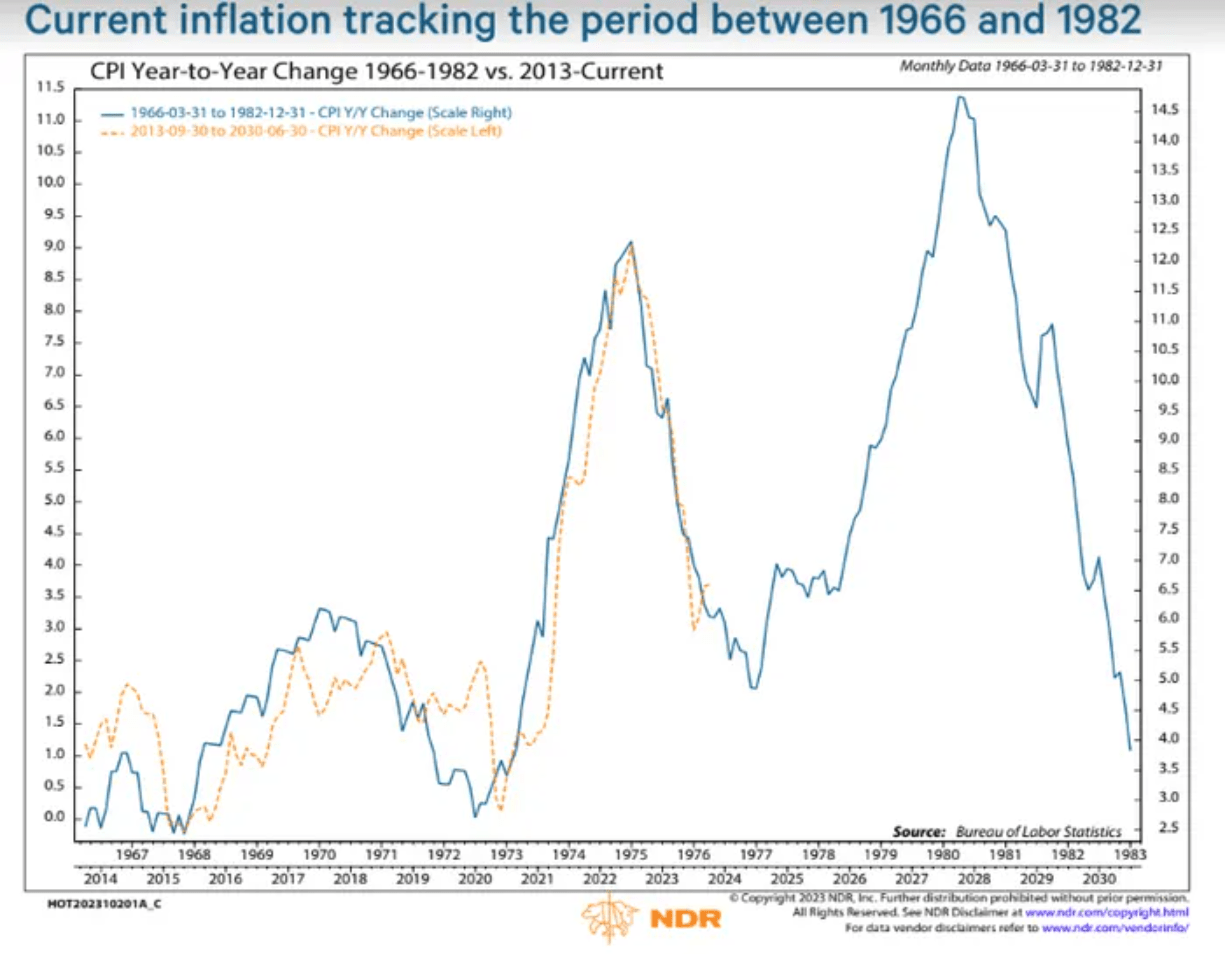
The first time I saw this chart, I found it haunting. There’s an eerie overlay between the inflation of the 1970s and the 2020s.
The early 1970s saw soaring inflation from the OPEC oil shock. The early 2020s saw soaring inflation as we fought off a pandemic with stimulus checks.
While history doesn’t always repeat itself, it rhymes.
And any event from war to another pandemic could mean more money printing, interest rates getting slashed to 0%, and with it, inflation soaring once again.
The late 1970s saw slow growth and another round of oil-driven inflation.
So yes, for many reasons, there could be much more to gold in the months and years ahead.
Gold’s Bright Future: $3,000 Per Ounce and Beyond
Where does the gold go from here?
With the price breaking higher, it could trend to $3,000 per ounce by the end of the year.
That’s only a 25% increase from $2,400. That’s a reasonable move for the metal.
A few Wall Street analysts are coming around to my view:
- Citigroup’s analyst team just put out a $3,000 price prediction last Tuesday. They said the metal could “shine bright like a diamond,” and test the $2,500 price point repeatedly before breaking higher.
- Goldman Sachs says gold is in an “unshakeable bull market,” but only sees a $2,700 price point for now.
- Banking analyst Ed Yardeni of Yardeni Research sees the metal moving to $3,500 by the end of next year amid another round of inflation. As Yardeni states: “Another wage-price spiral associated with rising oil prices will look a lot like the Great Inflation of the 1970s, when the price of gold skyrocketed.”
Why is gold picking up?
Demand.
Central banks remain massive buyers of gold.
China bought 160,000 ounces in March alone.
And while they’re reluctant to disclose specifics, Turkey, India and Kazakhstan have stated they’ve been buyers this year.
Retail investors are also big buyers. It’s usually hard to get specific numbers, given the large quantity of private sales.
But one Wells Fargo (NYSE: WFC) analyst reported that one retailer is selling between $100 million to $200 million in billion per month.
The company? Costco (Nasdaq: COST). The warehouse retailer started selling bullion online and in select stores late last year.
It’s been a massive hit. Their online sales sell out in minutes. If you get a chance to buy physical gold from Costco, go for it. As with their $1.50 hot dog/soda combo, you won’t find a better bargain.
The downside? You’ll need a safe place to store it at home.
That can be a big risk if there’s a fire or theft. That’s why I don’t buy my gold from Costco. Instead, I buy it from the Hard Asset Alliance.
The Hard Assets Alliance (HAA) allows you to store gold in a number of secure vaults worldwide.
I store my gold in a safe in Zurich, Switzerland.
The point is … you haven’t missed out on the opportunity in gold.
The metal may be near its highs, but it’s looking to make new highs thanks to surging demand.
Gold likely has another 25% upside this year, and more into 2025.
And with inflation potentially picking up, all commodities stand likely to benefit. So, let’s look at the opportunity unfolding now.
Gold’s Rally Extending to Commodities
Gold’s move higher is against the backdrop of a commodity boom.
Typically, commodities move in their own cycle, which is different from stocks.
Commodities generally boomed in the 2000s, then generally moved lower in the 2010s.
Gold is an excellent example of this. It hit $1,900 per ounce in 2011, but sank to a low of $1,050 by 2016.
Oil is another great example. It first topped $100 per barrel in 2008, up from $40 at the start of the 2000s.
But it went back to that low by 2014 — and even briefly traded negative for a few days in 2020!
Today, however, commodities are back in rally mode.
The Invesco DB Commodity Index Tracking Fund (NYSE: DBC) is the largest commodity ETF. It holds a basket of assets, including gold, base metals like iron and copper, and energy assets like oil.
Here’s how it’s performed over the past five years:
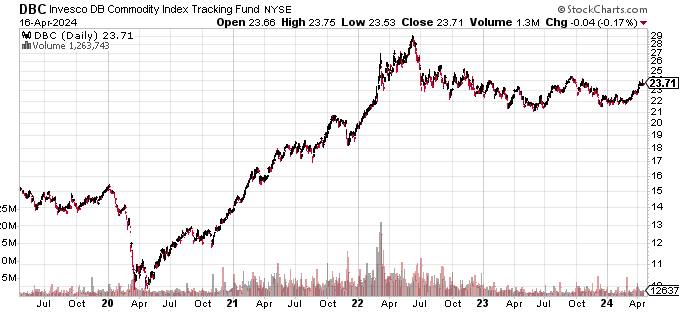
The commodity market tends to move in multi-year cycles of 7+ years. If we started a new commodity boom in mid-2020, we’re a little over halfway done.
And the above chart is beginning to look like it’s forming a cup and handle pattern. Once we break out of that pattern, we’ll see a new five-year high.
Given today’s lingering inflation and government money printing, this commodity boom should be no surprise.
Because of the long duration of commodity bull and bear markets, it’s also easy to forget that the end of the bull market tends to offer the best gains going forward.
The Top Winner for the New Commodity Boom
If I had to pick a winner for the commodity boom, I’d say oil.
Think about it…
It’s still well off its highs.
And given the inflation of the past few years, you could even say it’s downright cheap in real terms.
The recent global uncertainty and saber-rattling point to a potential oil price shock.
And since President Biden drained America’s Strategic Petroleum Reserve (SPR), we don’t have a significant buffer in place to absorb that shock.
Plus, as cool as some of today’s green energy technology is, it’s not ready to take over 100% of our power needs. Not even 50%.
Maybe 10% to 20% at best.
We’ve seen that electric vehicles need a consistent power source to charge. That’s not solar or wind. New nuclear power plants could offer a clean source of energy.
But as far as alternatives go, it won’t roll out as fast as many have predicted. That still leaves oil as the vital energy commodity, especially for transportation.
Money & Markets analyst Adam O’Dell has put together research on how surging energy demand could cause oil to move to $500 per barrel, blowing past all historical records.
Oil hasn’t made a new all-time high in over 15 years. However, prices could start to perk up in late May and really take off after OPEC’s June 1 meeting.
You can check out the latest research here, where he explains the influential trends driving oil prices substantially higher in the coming years and the best way to profit from this trend.

CEO, Banyan Hill, Money & Markets