Traders have looked at chart patterns for more than 100 years, and recent research has shown that some patterns are worth paying attention to. Researchers at the Cleveland branch of the Federal Reserve, for example, found that the “head and shoulders” pattern can be traded profitably.

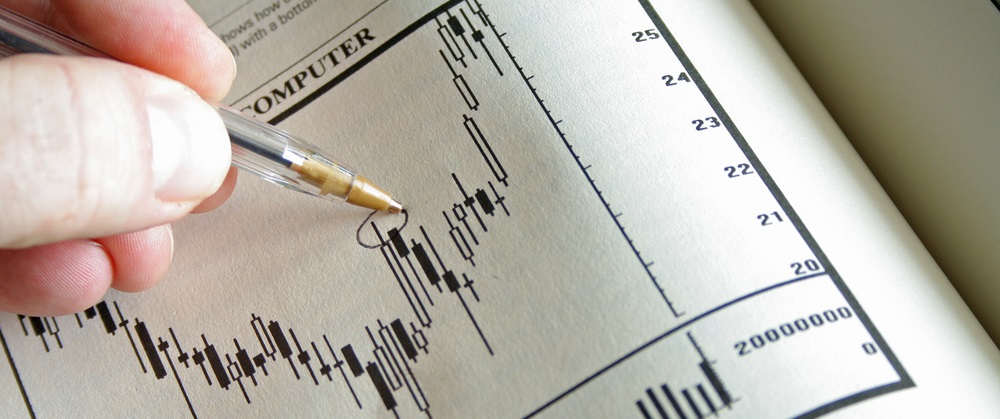
In the head-and-shoulders pattern, the left shoulder and head are a normal uptrend with higher highs. Then the right shoulder forms as prices fail to set a new high. Prices are expected to break down after falling below the neckline.
That makes the recent price action in the iShares Russell 2000 Index (NYSE Arca: IWM) potentially troubling to the bulls. IWM is a benchmark index for small-cap stocks. In the chart above, IWM could be in the process of forming a right shoulder, a process that often includes prices falling below the neckline and rebounding before the final breakdown occurs.
IWM appears to be completing a head-and-shoulders pattern, and a down move should be expected if the pattern is completed. A close below $130, about 3% below the neckline, could signal a trend reversal.
A head-and-shoulders pattern is bearish. The chart shown above indicates that a 9% decline is possible. That is based on a measuring technique that uses the depth of the pattern to forecast the subsequent price move.
This is important because small-cap stocks usually lead the market. If IWM breaks down, we should expect the S&P 500 and Dow Jones Industrial Average to follow.
But in this case, lower prices could pull more money into the market, eventually resulting in new all-time highs in the major indexes.
Major market indexes haven’t suffered a 5% decline since last June. A sell-off would be healthy, offering investors a chance to move money from the sidelines and setting up a move toward new highs later in the year.
Regards,
Michael Carr, CMT