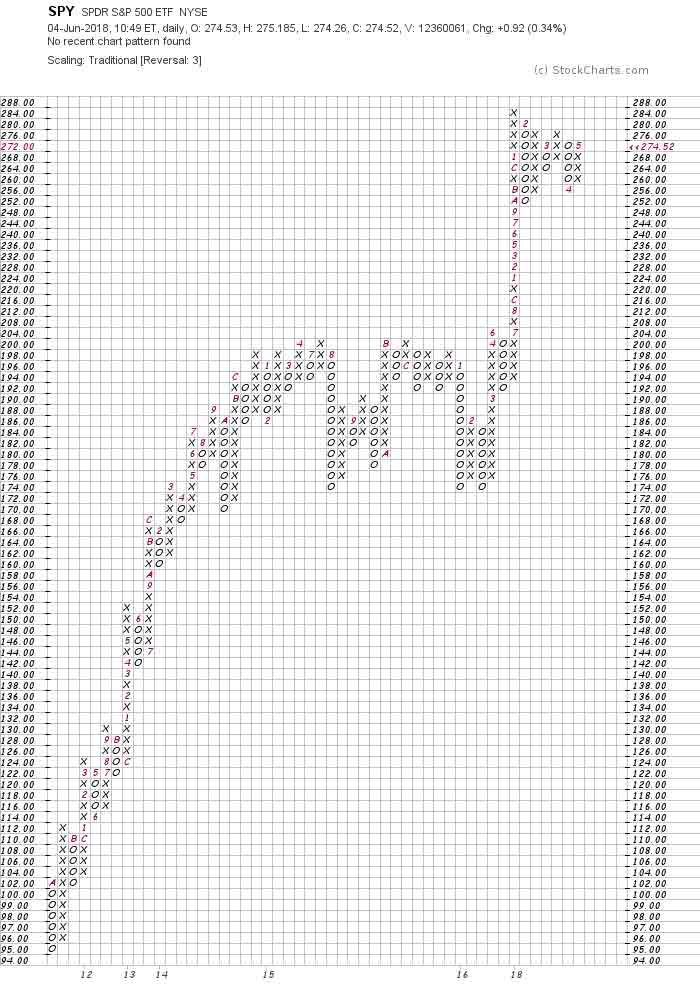
The S&P 500 Index is stuck in a trading range. The longer this goes on, the bigger the expected move when prices break out.
Technical analysts study charts. They develop market opinions based on patterns. One pattern they look for is a sideways move. This is called a base pattern.
Among old technical analysts, the saying is: “The bigger the base, the bigger the space.”
The chart below shows that the S&P 500 is set up to move at least 10.2% from its current level.
Base Pattern

The chart is a point and figure (P&F) chart. These charts show price action and ignore time. This helps traders focus on the direction of the trend.
When prices move up, the chart shows a column of X’s. Down moves are marked by a column of O’s.
In markets, there are three trends. Prices move up, down or sideways. Although traders expect to see uptrends or downtrends, sideways trends occur more often. These are times when alternating columns of X’s and O’s form on the chart.
P&F charts clearly show the sideways trends. We’re in one right now.
More importantly, the charts also forecast the size of price moves. The longer this base pattern builds, the bigger the breakout should be.
Right now, the chart says we should expect the SPDR S&P 500 ETF (NYSE: SPY) to move about 10% when it breaks out. That’s a short-term target. The long-term target says prices could move by more than 30%.
That’s the good news. Now, for the bad news.
The pattern tells us a 30% move is coming. It doesn’t say when it starts. And it doesn’t say which way it will go.
That means we could see a 30% down move.
So, let the market tell you how to trade. While we’re in the trading range, be cautious. If SPY closes above $280, buy aggressively. If SPY closes below $252, use bear market strategies.
This might sound like I want to have it both ways. I don’t. I am saying watch these levels and act when the time comes. Prepare now, because a big move is near.
Regards,

Michael Carr, CMT
Editor, Peak Velocity Trader


