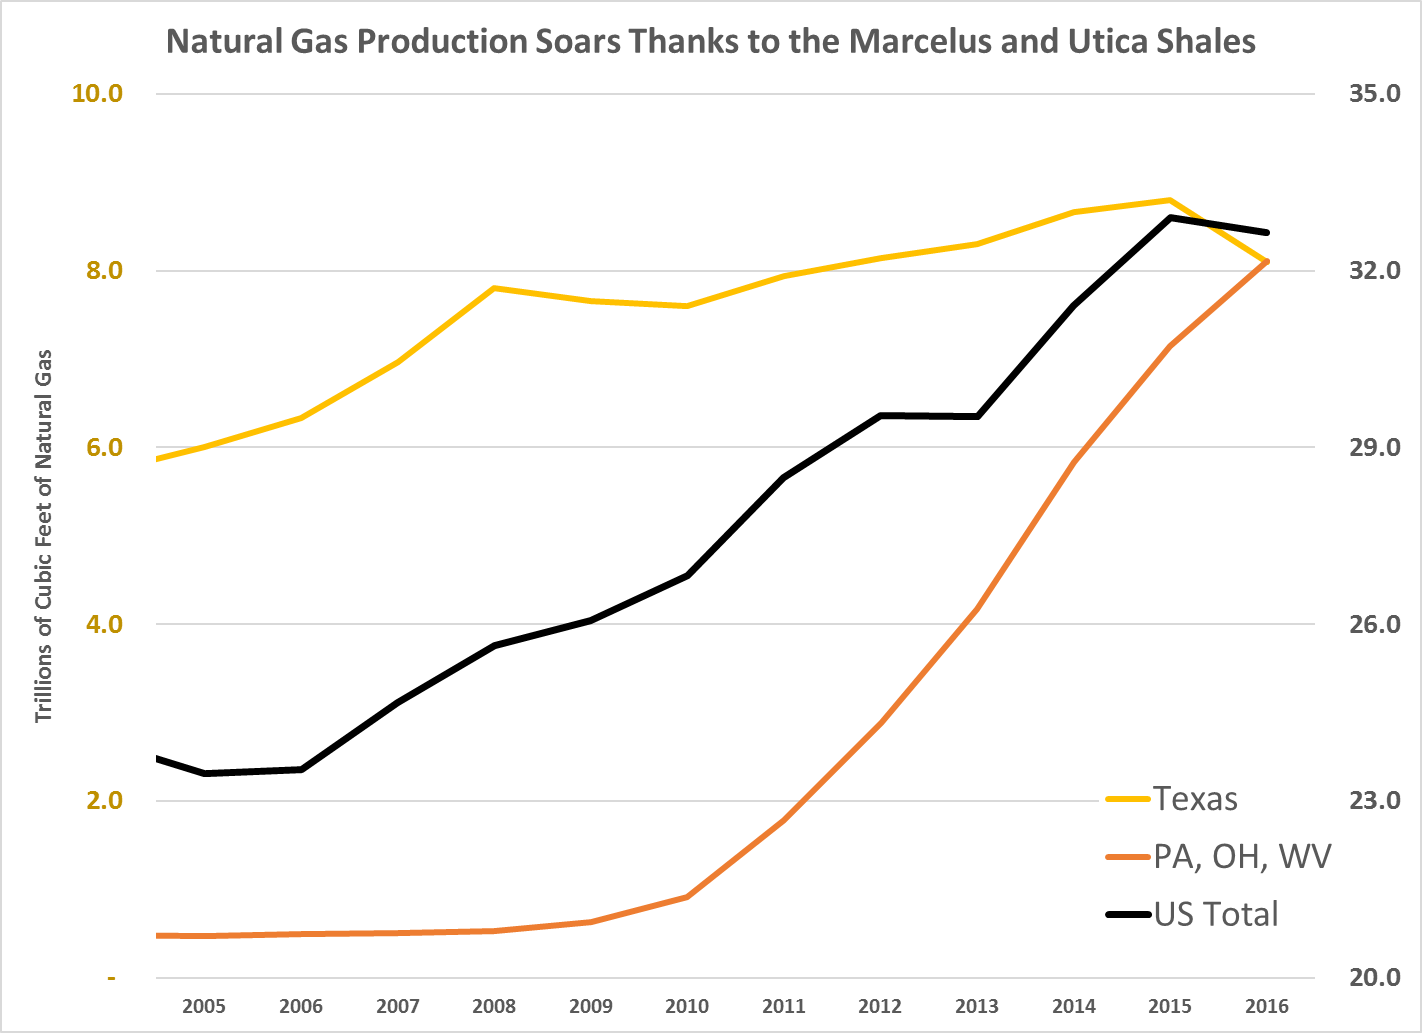
Something incredible happened in the U.S. natural gas market in August 2016. It was something that, back in 2010, few people would’ve believed.
David slew Goliath, in a spectacular fashion. It took just six years for three states in the northeastern U.S. to knock off Texas as the largest producer of natural gas in the country.
You have to understand that Texas dominated U.S. natural gas production since we began keeping track of it. Back in 1990, Texas produced nearly a third of U.S. natural gas. Louisiana produced 25%. However, Ohio, Pennsylvania and West Virginia combined only produced about 2%.
Over the next 20 years, that distribution changed dramatically, thanks to the shale revolution.
America’s Shale Bonanza
Shale, as you probably know, is a thinly layered, organic-rich rock that holds enormous amounts of oil and gas. In the early 1990s, engineers cracked the secret to making shale release its oil and gas. Once the industry figured out the technique, they rushed to drill shales all over the U.S.
The Bakken Shale in North Dakota is one of the most famous, thanks to its enormous quantity of light, sweet crude oil. The companies there produced so much oil that they quickly overwhelmed the meager pipeline capacity. Oil had to be put on railcars to get it to market.
A more significant, if less publicized, bonanza began in three northeastern states in the late 2000s. Two well-known shales — the Marcellus Shale and later the Utica Shale — began to produce enormous amounts of natural gas. The shales underlie Pennsylvania, Ohio and West Virginia. The chart below shows just how much natural gas production increased:

This dramatic increase in natural gas production was the opposite of what the industry experts forecasted in the early 2000s.
I don’t remember anyone predicting a mass surplus of natural gas in the U.S. back in the late 1990s and early 2000s. The accepted theory was that the U.S. would need to import natural gas. Everyone expected double-digit prices to be the norm by now.
However, that’s not the case at all. Quite the opposite happened.
Thanks to the shale revolution, natural gas production soared. By 2012, the U.S. edged out Russia to become the world’s largest producer of natural gas. As you would expect, as supply exploded, prices collapsed.
Natural gas prices fell from a high of over $14 per thousand cubic feet (MCF) in 2008 to below $2 per MCF by 2012. The price recovered briefly in 2014, only to plummet under $1.70 per MCF in 2016.
Natural gas is so plentiful that a Dutch fertilizer company built a major new plant here. The first of its kind in the U.S. in 25 years, it uses natural gas to make nitrogen fertilizer.
Cheap natural gas prices are here to stay. As oil prices rise and oil drilling picks up again, natural gas production will go up with it. Don’t expect to see high natural gas prices in the U.S. anytime soon.
Good investing,

Matt Badiali
Editor, Real Wealth Strategist
P.S. It’s no secret that a stock can suddenly pop or drop the day after a company releases its quarterly earnings statement. But most people don’t realize that some stocks have a tendency to continue drifting upward or downward for several days, weeks or even months after that initial pop. And that drift holds the key to the incredible, rapid-fire gains that have been seen in Chad Shoop’s new Earnings Drift research service. To sign up for the webinar and find out how the model portfolio closed out gains of up to 101% in as little as five days, click here.


