On Friday, the yield curve inverted for the first time since 2007.
This is a time-tested recession warning. It’s also a signal that the bear market is near.
But the Federal Reserve put us on this path more than a year ago.
I highlighted the Fed’s problem in December 2017. That means the invested yield curve isn’t a surprise. And the upcoming bear market shouldn’t surprise anyone either.
Another time-tested indicator is pointing to a stock market decline right now.
In 1687, Sir Isaac Newton described momentum as a fundamental part of the physical world.
Newton’s first law of motion says: “An object at rest stays at rest. And an object in motion stays in motion with the same speed and in the same direction unless acted upon by an unbalanced force.”
This law explains the trajectory of a golf ball. It also explains many stock market moves. That’s because market analysts closely follow momentum.
There are dozens, if not hundreds, of technical indicators designed to measure momentum. These include popular technical indicators like the Relative Strength Index and the Moving Average Convergence Divergence (MACD).
Newton’s first law inspired the interpretation of these indicators. Prices continue moving in the same direction until some outside force creates an imbalance.
That force is almost always something that changes how investors feel about prices. It could be a bad earnings report or an announcement from the Federal Reserve.
But momentum indicators don’t seem to work for many investors.
That’s because they look at momentum indicators based on short-term data. Instead, they should consider momentum of long-term data.
A Popular Analytical Tool
When investors are bullish, they buy. When they’re bearish, they sell.
Momentum indicators directly reflect sentiment. The more bullish investors are, the more urgently they buy. That makes momentum indicators rise.
As bullishness wanes, the pace of price gains slows. Momentum indicators reflect this price action.
The trend remains up until investors start selling. The decision to sell requires a shift from bullishness to bearishness.
But shifts in sentiment, for groups of investors, tend to be slow.
A Simple View of Momentum
MACD is one of the most popular momentum indicators.
It uses two moving averages. That’s the “MA” in the name.
The indicator is the distance between the two averages. When they converge or diverge — the “CD” in the name — MACD offers buy and sell signals.
Because sentiment causes momentum, many investors are using MACD wrong.
They look at daily or weekly charts. But momentum shifts gradually, so investors should use monthly charts.
Short-term traders rely on short-term charts, but long-term investors should ignore day-to-day market moves.
The chart below shows MACD for the S&P 500 Index with monthly data.
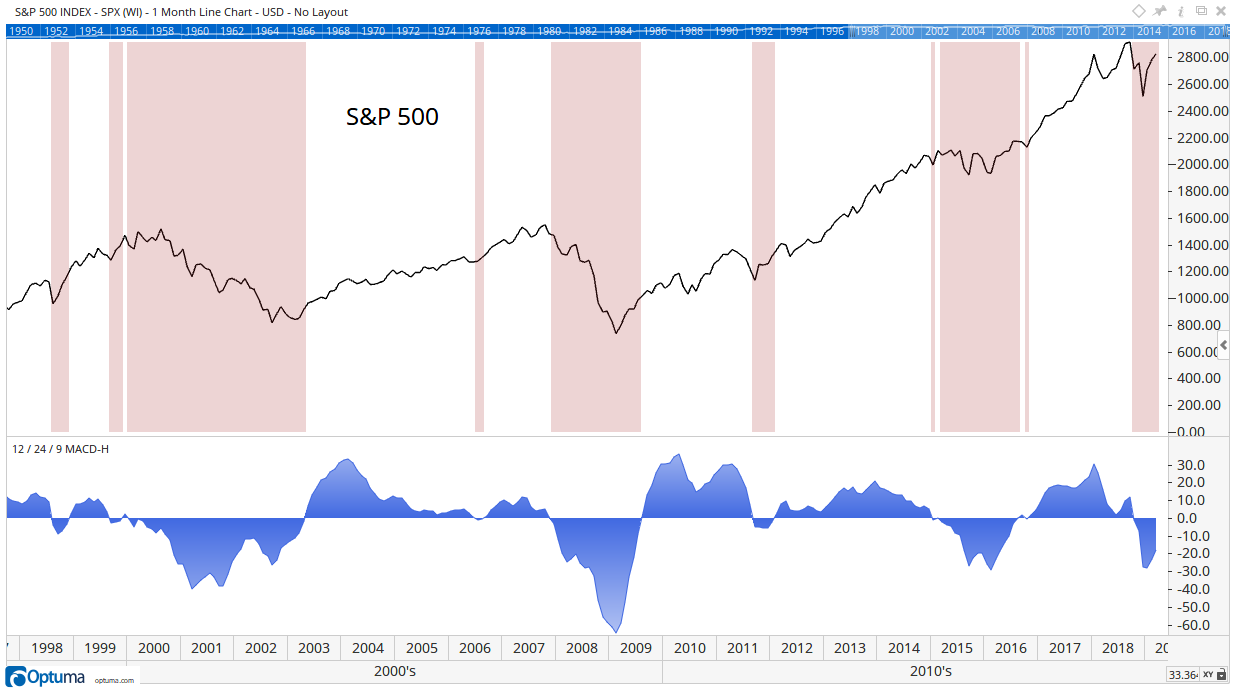
Red areas highlight times when MACD was bearish. These periods aren’t all bear markets. But these periods all coincide with market weakness or pullbacks.
How Effective Is Monthly Momentum?
Visually, this chart offers a great investment strategy: Simply get out of stocks when monthly MACD is bearish.
We can test that idea.
Over the past 20 years, selling all stocks and holding cash when MACD was bearish would have beaten the market. Tested on the S&P 500, the strategy gained an average of 4.7% a year while the index gained 4.4%.
Best of all, risk fell by more than 76%.
The largest loss over the past 20 years for a buy-and-hold investor was 55%. The MACD strategy’s largest loss was 12.8%.
Using the entire history of the S&P 500 back to January 1928, the buy-and-hold investor fared better, gaining an average of 8.6% compared to 6.3% for the MACD strategy. MACD reduced risk by 69% in that test.
Overall, the test results are impressive. MACD avoids large losses.
Bear markets are life-changing. Losses of more than 50% can lead to delays in retirement. With smaller losses, MACD can ensure you meet your financial goals.
This strategy moves to a cash position when monthly MACD is bearish. This might not be possible for all investors. Fortunately, there are alternatives.
You Can Always Act When Momentum Is Bearish
Instead of going to cash, investors could simply stop buying.
That means they avoid adding to positions until MACD turns bullish. Cash builds up in the account. It’s invested only on the next buy signal.
That simple strategy, called “Don’t Buy in a Bear Market,” increases wealth because you should end up investing closer to the bottom. The same amount of money buys more shares at a lower price.
More aggressive investors can add short positions. Shorts increase in value when prices fall. Individuals should probably never directly short the market.
A short sale means you borrow shares from your broker and repay that loan later. There are costs to borrow shares, and the costs often rise in bear markets. Costs alone could eat up the gains.
There is also the risk a large rally can cause losses. In theory, losses on short trades are unlimited. In general, only investment professionals use this strategy.
Instead, individuals can benefit from price declines with inverse ETFs.
Inverse ETFs are exchange-traded funds that increase in value when the index they track goes down. By moving inverse to the index, these funds lose money when the index rises.
Examples of inverse ETFs include ProShares Short S&P500 (NYSE: SH) and ProShares UltraShort S&P500 (NYSE: SDS).
Day to day, SH should move as much as the SPDR S&P 500 ETF (NYSE: SPY) in percentage terms but in the opposite direction.
An UltraShort fund like SDS should move twice as much as SPY in percentage terms but in the opposite direction.
All ETFs are rebalanced daily. Over two days or more, the relationship between the ETFs and index varies. This means they can deliver bear market gains but may not be the right choice for the long-term investor.
There’s a Better Way to Invest During Bear Markets
Put options are the best bear market investment.
Put options give the buyer the right to sell 100 shares of a stock or ETF at a certain price before a specified time.
They generally cost about 2% to 3% the price of the stock. This means they can deliver large gains when markets make small moves.
Options are short-term trading tools. So, investors should take profits from time to time in a bear market.
It also means they can open new trades at a low cost. That keeps risks small.
And with put options, you can never lose more than your initial investment.
Right now, monthly MACD is bearish. In the past, this was bad for stocks.
A put option on SPY is an ideal trade for long-term investors and short-term traders right now.
And I’ll continue to keep you updated on how the latest developments regarding the yield curve will affect your investments.
Regards,

Michael Carr, CMT, CFTe
Editor, Peak Velocity Trader