

Last week, growth stocks dropped into correction territory as investors scrambled to reposition themselves for a Federal Reserve-dominated year.
Many analysts and the talking heads are saying now is the perfect time to buy the dip. This is true, but only if you do it smartly.
That’s why, in today’s installment of Your Money Matters, Ted Bauman and Clint Lee evaluate the market metrics to help you make the most profitable decision.
They consider what sectors stand to make the most. That’s where you want to go fishing. And they discuss if there is a universal method you can apply to all sectors. Finally, they give you the details of four exchange-traded funds to invest in to maximize this market rotation.
Click here to watch this week’s video or click on the image below:
TRANSCRIPT
Clint:
Hey, everyone. Clint Lee here along with Ted Bauman with the next edition of Your Money Matters. Before we get started, as always, be sure to check out the link above my top left, should be in the top right-hand corner of your screen, to learn how to get started with The Bauman Letter. Lots of different opportunities across different sectors, different risk/return makeups in our model portfolio, so click the link to learn how to get started there.
Today, I want to talk about the dip that we had here in the stock market lately. I think the Nasdaq is now down about 10% off the peak and so everyone’s wondering now: Is this the time to step in? A lot of dip buying has happened before and so Ted, I know you wrote something here just recently about how to use fundamentals, how to use valuations. Those things matter to evaluate an opportunity so I wanted to start there and get your take on what you’re looking at, how you’re evaluating the space. Maybe let’s start with growth stocks and what you’re seeing there so far.
Ted:
If you want to take everything and put it into one metric you could use duration. You can think of duration as the number of years it would take an asset to generate enough earnings to be able to justify its current price. There’s some debate about this. It’s certainly not an exact science. For example, if a stock has a duration of 10, let’s say, and interest rates go up by 1%, then the idea is that they would fall by 10% in price for every once percent increase. And write now the S&P’s average duration is 36.5, so a one percent increase in interest rates, given that duration, which is a function of valuation … Highly valued stocks take longer to earn back the money that you spent on the stocks. When you get durations at that level, a one percent increase could basically be catastrophic for the market.
And this is why I think the Fed has been signaling so early, because they want the market to know this. They don’t want the market to find out … to get blindsided by this. This is all part of the whole kabuki that’s going on between the Fed and the market. What we’re seeing now is anticipatory because the whispers are that the Fed’s going to raise rates faster than everybody things. That’s what they want them to think. The market is telling the Fed that the think that and whatever happens, whatever we’re looking at, is going to be a big pull back in growth.
Clint:
I think one point there, too, about duration and just the valuation aspect…
Another way to think about it, too, is: What’s the timing of your cash flows? When do your cash flows occur?
Ted:
Right.
Clint:
Because growth stocks have become such a dominant force in an index like the S&P 500. A lot of growth stocks, a lot of that profitability rests way out into the future. That’s what makes that whole discounting mechanism of bringing those cash flows back to present day. The further out they are, the more impact that discounting mechanism, so when you having rising rates that’s where you really start to see the impact and why that duration figure you threw out there for the S&P 500 has been so impactful so far this year.
Ted:
And remember, you get the duration for the index but then you get the duration for individual stocks. We’re seeing plenty of stocks that have lost over 20% of their value already this year, even more. And those are the stocks that basically have that long pathway to profitability. But let’s just flash a chart that illustrates this:
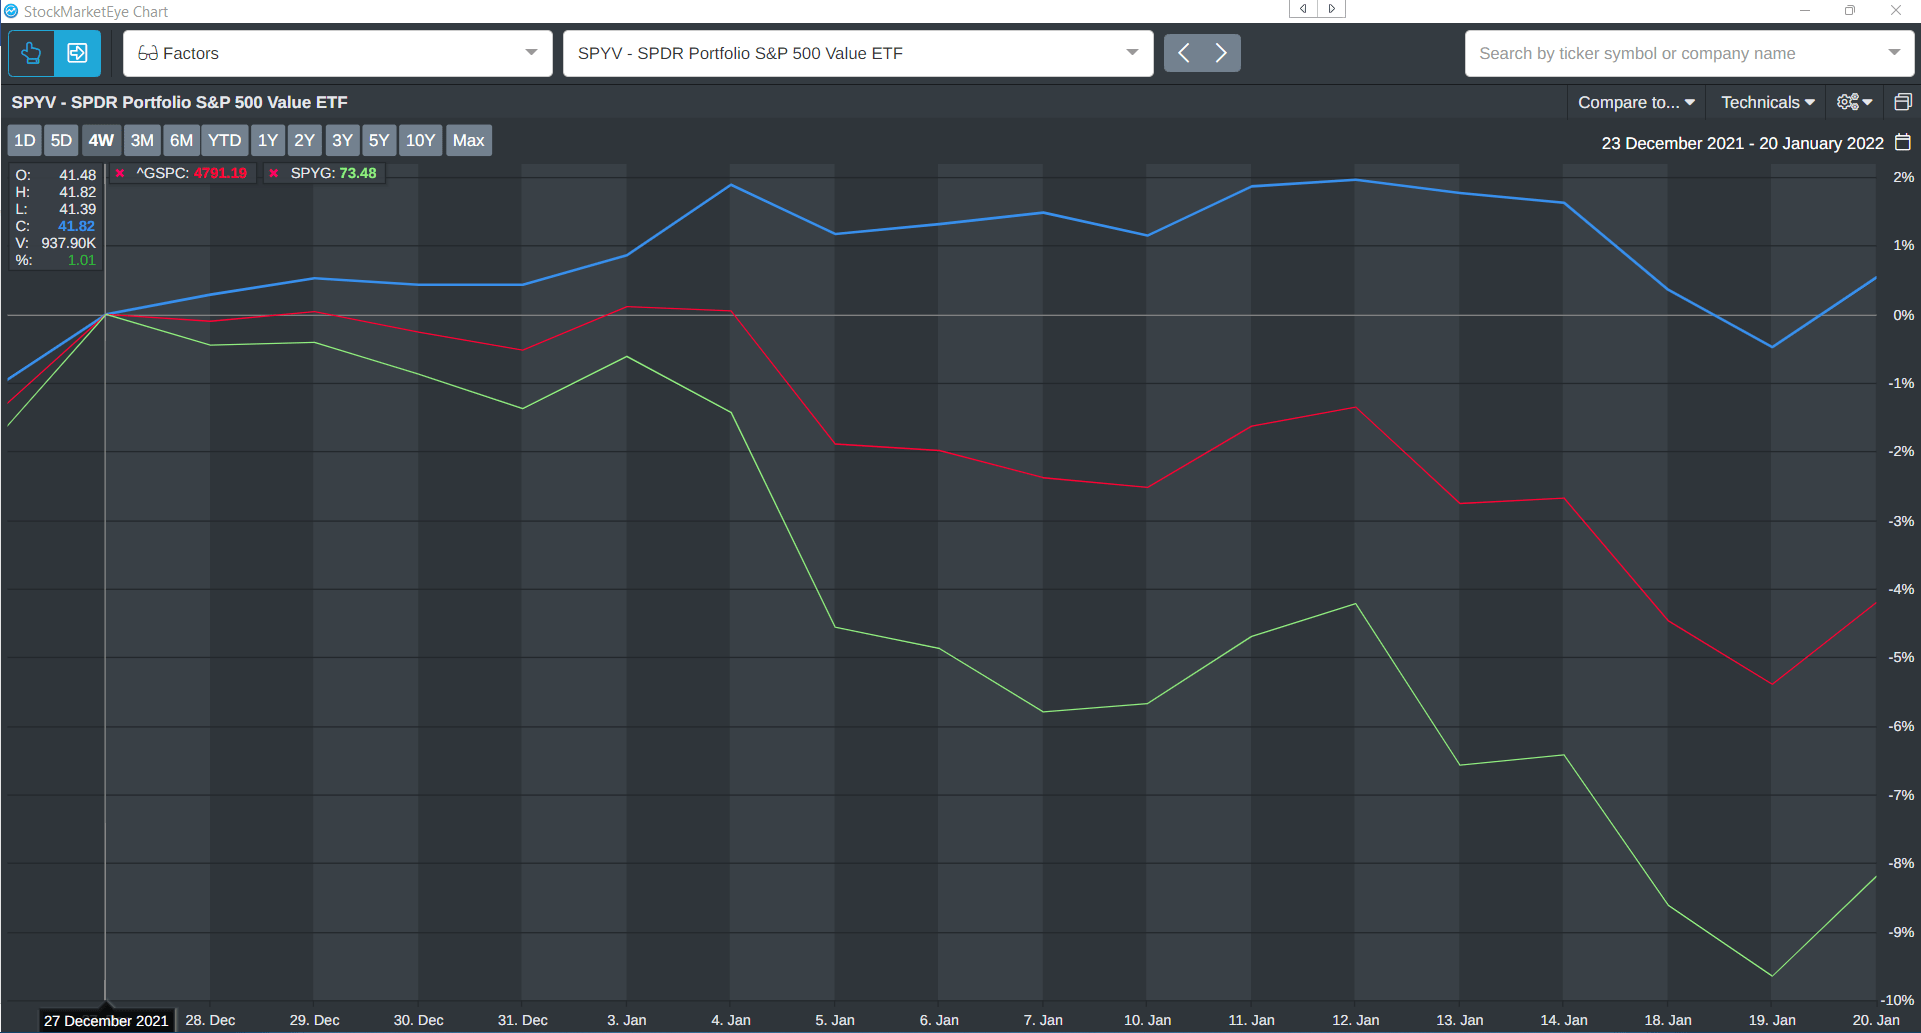
Basically, the blue line is the S&P 500 Value ETF, which represents the value stocks. The red is the S&P and the green is growth stocks. And that’s a pretty straightforward picture. The only ones that are in positive territory at all are the value stocks. But there’s a second factor here, and I just flashed it up quickly. Here’s a little table that shows the expected EPS increase for this year and over the next two years for those three categories: growth, value and the overall market.
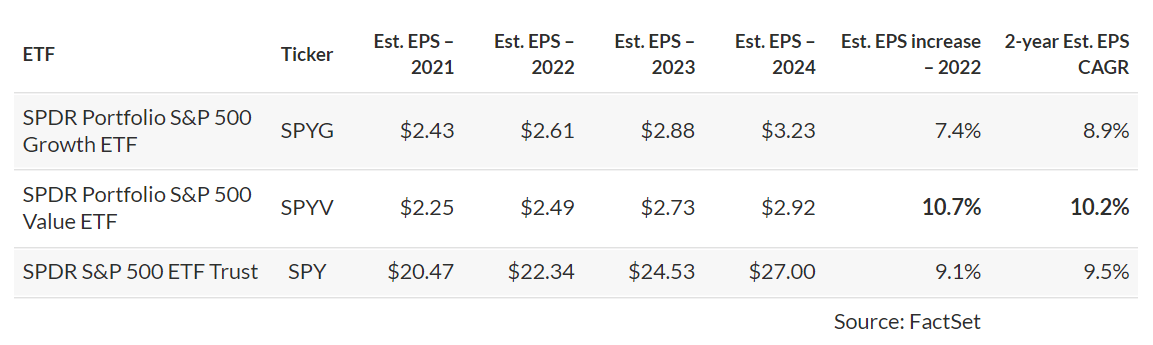
And clearly, value’s going to lead. But you take those two things together and boom, you get a rotation, which is what I think we’re seeing.
Clint:
I want to go back to what you were writing about earlier this week. I know you went through and you broke down a bunch of different types of fundamental metrics to valuate stocks on. And I think one thing that’s important to highlight is that there’s not necessarily a “one size fits all.” There’s not necessarily one metric in particular that you can use across every sector. For the most part, analysts are evaluating industrials, at least from a valuation standpoint, on enterprise value relative to their EBITDA or something like the REIT sector. To try to use a price-to-earnings ratio to evaluate a REIT is pretty much pointless.
Ted:
Yeah.
Clint:
You need to use cash flow. My one question is, to the extent that there could be something that’s at least close to one size fits all, is there a metric, a gauge? Is there something that you use that the viewers could use to quickly evaluate what’s going on across different sectors?
Ted:
Yeah, I would say it’s probably the PEG sector. It’s the one I like the most. Like you just said, you have to look at price in relation to the appropriate kind of earnings growth as opposed to, for example, you said REITs. That’s funds from operations, FFO or adjusted FFO. If you use that as your measure of growth then I think PEG is a more or less a one size fits all because what it does is it tells you the relationship between the current price-to-earnings ratio and its trailing 12 months growth in whatever the metric is, whether its funds from operations or earnings or whatever. And the great thing about that is that it tells you straightaway whether a stock is moving sufficiently quickly toward its high valuation, whether its justified.
Again, it’s not a one size fits all. There are lots of reasons. For example, some companies choose to use their earnings to reinvest in themselves and so that might keep their earnings growth slow but the market knows that they’re doing that so they price them highly anyway. Amazon is the classic case in point. Did that for a decade. So, you got to dig under the hood. And that’s, I think, the critical thing here, is that once you shift from technical analysis of price movements to fundamentals, there’s a lot more work involved or just a different kind of work. You have to understand what drives those metrics and I think that’s a key piece of advice for people.
But just to give it some time to be able to give some recommendations here, I just want to also show a chart that shows the 10-year Treasury yield right now.
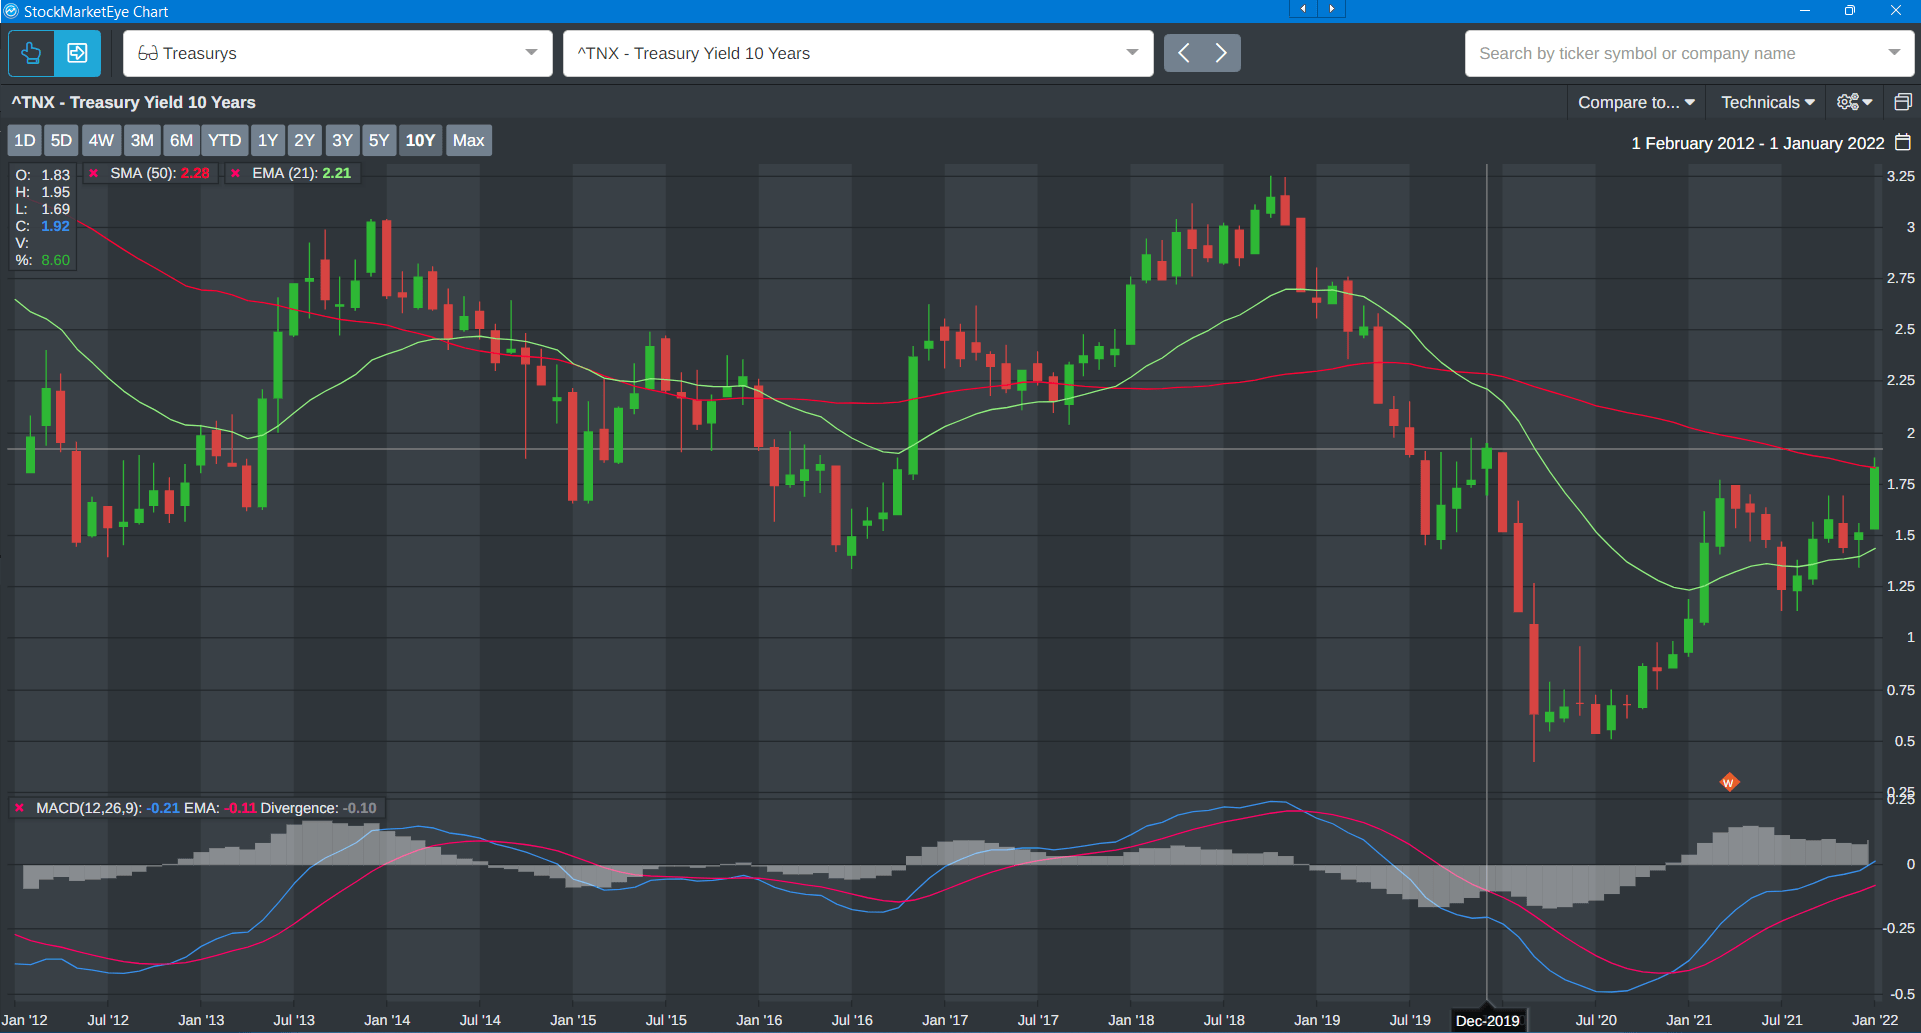
Right now, it’s testing the previous high of December 2019 before the pandemic. As you can see, those three big drops in the next three months, that was all pandemic-related anticipation. But the key thing here is that the rates were rising pretty quickly towards the end of 2019 and I think they were probably raising back toward the next resistance level, which is somewhere around 3% yield on the Treasury. If that happened, if we went from where we are today, which is about 1.85% to 3%, then you’re going to see a whole world of pain across different parts of the market. And so, paying attention to those valuations is what we’re doing.
Next question is, if all this works out the way we think, where do we go next? What do you like at this point?
Clint:
If I put on my valuation lens and I want to look for opportunities that are out there, one thing I’ve been talking about for a little while is on the international side. We bring that up every now and then, we talk about the valuation differentials between what you’re seeing here in the U.S. and internationally. I’ll show you a chart right now just to point that out. This comes from Topdown Charts:
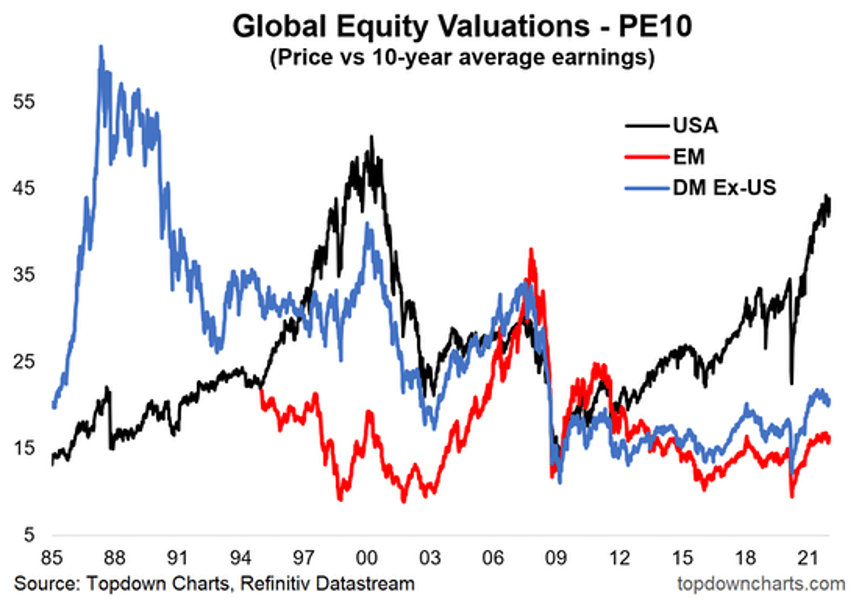
This looks at the valuations, the P/E ratio using a 10-year average of earnings, so that’s that cyclically adjusted P/E ratio that we’ve talked about before, just comparing it across three different regions.
You have the U.S. as the black line on here. Developed markets excluding the U.S., so developed international is the blue line and then emerging markets is the red line. You can see this P/E ratio, this goes all the way back to 1985. You hear about all the comparisons of U.S. valuations to the dot-com bubble. Well, this shows exactly that. We got this ration back up into a dot-com bubble territory, pushing around 45 on that ratio. Meanwhile, look at where we are with emerging markets in particular, developed markets, as well. They’ve come up in recent years but they are well below, still well below, their prior peaks.
I think this is an interesting time to be looking at international because look, a lot of what’s driven the US markets out-performance over the last several years has just been stronger US growth and the dominance of US companies and what they’ve seen in terms of their earnings potential. But I’m wondering if that’s starting to change a little bit here because we’ve got the Fed embarking on this very hawkish pivot. At the same time, something like the … Probably the most important central bank is the ESB. They’re still maintaining this transitory message for inflation, which is important because they’re still insisting they’re not doing anything on the rate front until 2022 and so that’s more stimulus for the economy.
And look at how this is starting to show up. I saw this chart from Liz Ann Sonders this morning and this shows the Citigroup’s economic surprise index for the US is the blue line on here and the Euro zone’s the yellow/orangish line.
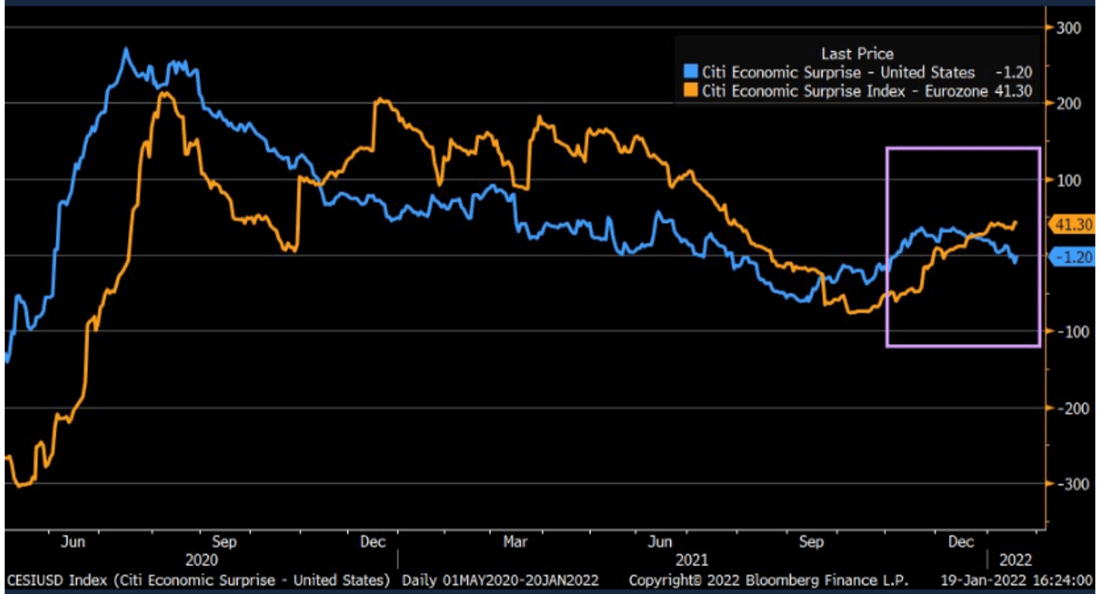
And what this is showing is how economic data is currently coming in relative to expectation. Just recently we’re seeing a pullback in how US economic data is coming in relative to the expectations. It’s underperforming while Europe’s picking up. I bring this up because once again I think what you’re going to see at the stock prices is movements that are reflecting growth differentials. Are we seeing the early innings of the Euro zone outperforming the US in that regard?
The last point I’ll bring up with all this is currency movements are incredibly important. For a US investor looking at international opportunities, a strengthening dollar hurts your returns. A weakening dollar, a strengthening foreign currency helps your returns. And last chart I have here for this is that US dollar has been on a tear over the past year but it’s finally starting to show some signs of weakness. Here’s the US dollar index.

I’ve got these green channel lines on here to illustrate this channel and just how strong the dollar’s been. Once again going back to about April or so. April or May of last year. And we’re just now starting to break below this channel along with that black line, the 50-day moving average.
At least from a technical standpoint, we’re starting to see a little bit of a breakdown there. But one of the things I think is that’s showing up in that growth outlook differential that you’re starting to see emerge in the US versus international regions.
There’s two quick ways to play this and I like these because it’s a way to generate income. One is with the IDV. It’s an iShares International Dividend ETF. It has a yield of about 7.6%. This is just a way to purely pay the developed international space. The big sector weights are financials and utilities. The other way, if you want to get more specific to holding emerging markets, there is a … DEM is the Wisdom Tree Emerging Markets High Dividend ETF. It has a 5.9% yield and 35% of its holdings is split between energy and materials, so you’re getting some commodities exposure there.
One thing I’ll warn you about when you look under the hood to this, depending on your viewpoints on China and Taiwan, those two countries make up about 45% of exposure. I know there’s some users who probably don’t want to get anywhere near China whereas others are looking at bargain opportunities with a pullback on many of those names there.
Ted:
And both of those ETF and up almost 6% this year, so good spotted there. On the China thing, remember the nice thing about ETFs is that, particularly if their actively managed, you can change your holdings based on what’s going on under the hood. Maybe the China thing, it could go either way. You might see them change the composition. For my side, I like commodities. Here’s a chart that shows average annual returns going back to 1970 during periods of declining inflation and increasing inflation. Clearly, the winner when inflation is declining is stocks and when it’s rising, it’s commodities. And there’s a lot reasons for that but one of the critical reasons, I think is that commodities, because they tend to be priced in dollars, if inflation is rising then their prices will rise along with it.
The other thing is that rising inflation generally goes along with strengthening economic activity, which means that the demand for commodities increases. And of course, commodities can also play a hedge against inflation and also dollar weakness. There’s all kinds of reasons why you want commodities. And of course, everybody’s favorite commodity, for better or for worse, is oil. We know what oil’s doing. I don’t know what it’s doing today but it was pushing $90 a barrel earlier this week, so any way you look at it, commodities is a good space to be.
My two plays would be GSG … These are both ETFs that really use futures and that’s the way you want to play commodities because then what’s happening is you’re getting the future price action built into the contracts; into those futures contracts. That’s why I think these are both up quite strongly this year as well. You can see if you go over here on the right-hand side, here’s GSG’s chart.
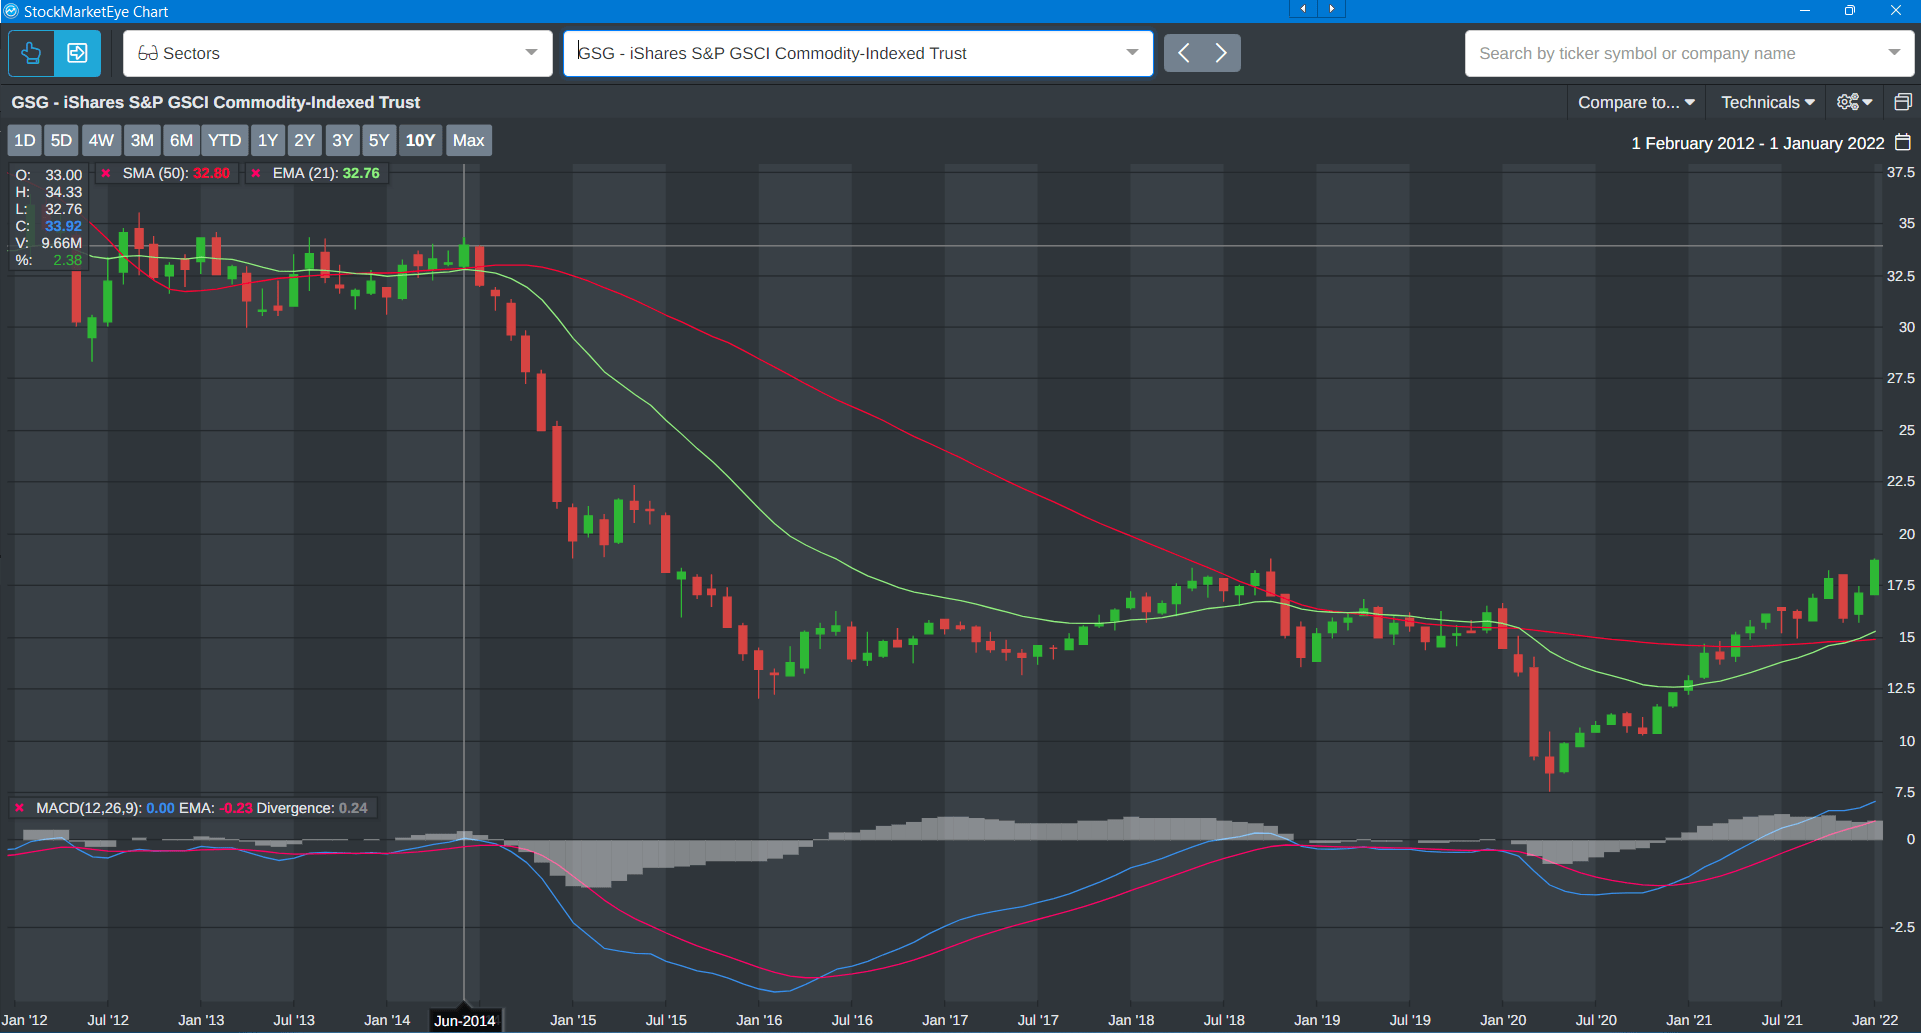
You can see pretty strong green arrow there. But look at its previous high back in 2014. 2014 was when the Fed gave up fighting back against the market. There was the temper tantrum and then the Fed started pulling back. But the key thing was that inflation rates were just going slower and slower and slower. We had this slow-flation economy throughout the 2000s and the 2010s and all that … Sorry, the 2010s. And that, really, wasn’t good for commodity. And global growth was like two percent year; it wasn’t great. And now that’s all changing.
Look at the potential price appreciation there. Put the crosshair on the previous high, you could maybe get back there. I don’t think you’ll get back there immediately, but that’s the potential. Here’s DBC, which is another ETF, same kind of action. It’s risen, actually, a lot more strongly than GSG but it still has a ways to go to recover its previous highs. Those are easy ways to play commodities and if you look under the hood of both those you’re going to see futures contracts so you can’t play that directly yourself unless you sign up with a … What do they call them? CTAs or …
Clint:
Right, the commodity trading advisor. Yeah.
Ted:
The commodity … yeah. Which is a whole other ball game. But this is a way you can get a piece of that action, so that’s my recommendation.
Clint:
All right. Well, there you go. Yeah. If you’re out there, if you’re evaluating a buy the dip opportunity, there’s a few valuation metrics we talked about to help you evaluate those but otherwise, the big issues facing the markets today, valuations and inflation and we’ve given you a couple different ways to play both of those things here.
That is all for us this week. This is Your Money Matters and please remember to check out The Bowman Letter. Just click the link above my left shoulder on the top right of your screen there.
Ted:
And oddly enough, it doesn’t appear as a link, does it? It’s a little round dot with an I in the middle of it.
Clint :
With the I.
Ted:
I finally realized that after all these years. Click the “I” folks and see what you can do. Remember, it’s a money back guarantee. Anyway, we’ll talk to you again next week. Bye bye.
Good investing,

Angela Jirau
Publisher, The Bauman Letter