
As of Wednesday, the top technology growth stocks were down 8.5% in the Nasdaq 100.
That’s why in today’s video, I show you how rapidly rising interest rate expectations are driving massive rotations in the stock market.
I explain the concept of “duration” and predict the magnitude of these shifts.
But the news is not all bad.
Every rotation has an upside as well. By adopting a simple Big Picture-based trading system, I show how you can make Big Profits in 2022.
Transcript
Hello, everyone. It’s Ted Bauman here with your weekly Friday video. I made it through the Bauman Daily and The Bauman Letter. And if you look up in the far left-hand corner of your screen, you’ll see a little letter with a circle around it. If you click on that, that’ll give you everything you need to know about subscribing to my service.
Let’s talk about what’s going on in the markets first. You’ll probably notice that I’ve got a little wound in my nose, had a little accident with a falling branch, with that big winter storm that came through Atlanta the other day. Don’t worry about me. I’ll be fine. But anyway, be careful out there. It can be tricky when the wind is blowing the way it was then. Let’s have a look at what’s going on in the markets. The big news today, of course, is the breakout of the 10-year Treasury yield.
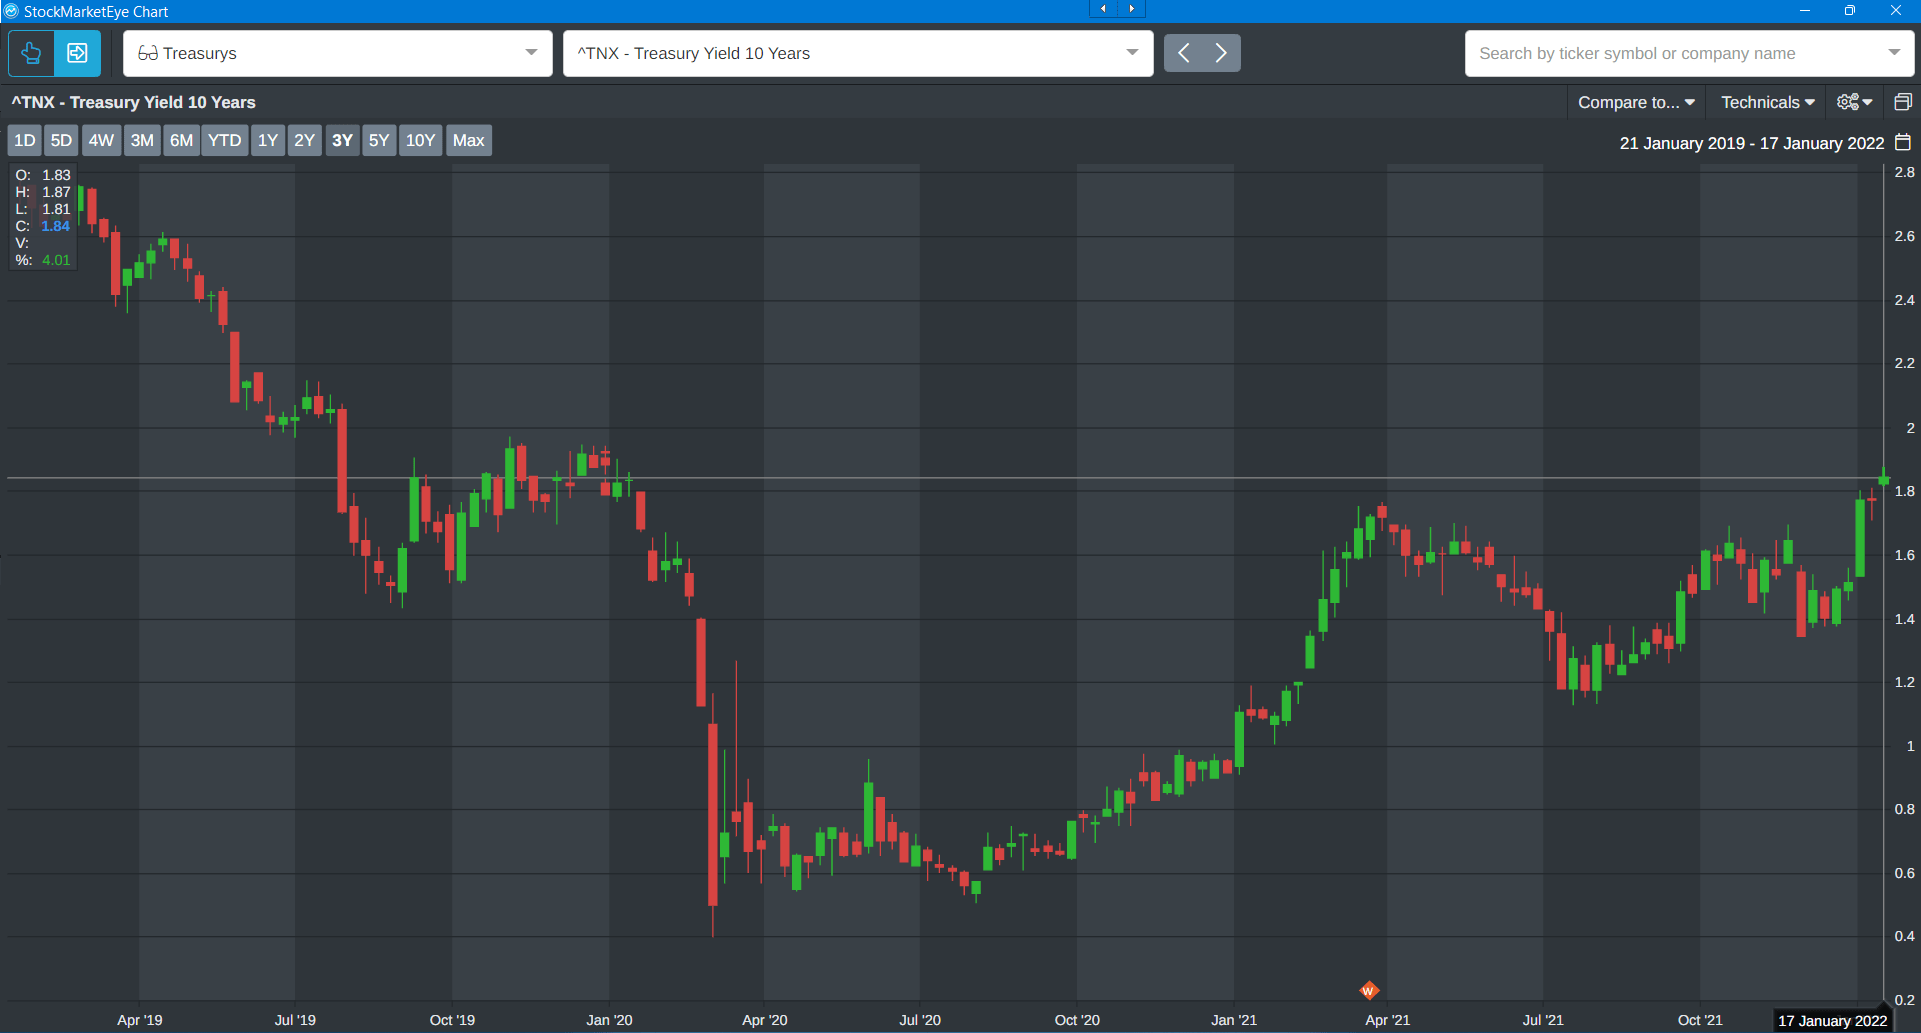
It’s now sitting at about 1.84. That, of course, is the nominal yield, but we have broken above the level that we saw in April of 2021, which led to a huge pullback in tech stocks. The key thing is we’re pushing up to levels that were in place before COVID. In other words, we’re looking at a scenario where the next level of yield resistance is going to be somewhere around 1.95. If yields break out above 1.95, we could easily see them go up over 2% in short order. Now, what does that mean for stock markets?
Well, I think one of the critical things is that right now, yields are still in negative territory.
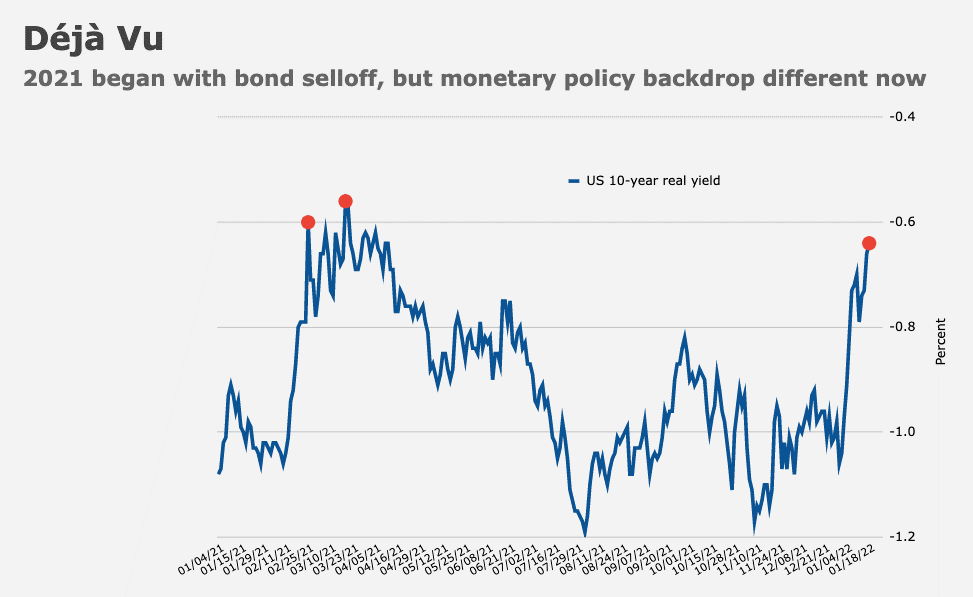
Here is that the U.S. 10-year real yield, and I point that out because when you think, “Well, the interest, the Fed is raising it so rapidly and this is unprecedented.” No, this is not unprecedented. What’s happening here is the Fed is trying to push real bond yields above negative territory.
They’ve been in negative territory really all of last year. Now, obviously this is a function of inflation, because real yields are the difference between nominal yields and inflation. But we are pushing toward a negative real yield of 0.6, which we tested before. But the critical thing is when we tested it before, there wasn’t pressure on the Fed to raise rates.
Now there is.
So what does that do to the stock market? Well, we’ve had the worst start to a year since 2016. Here are the three major indices:
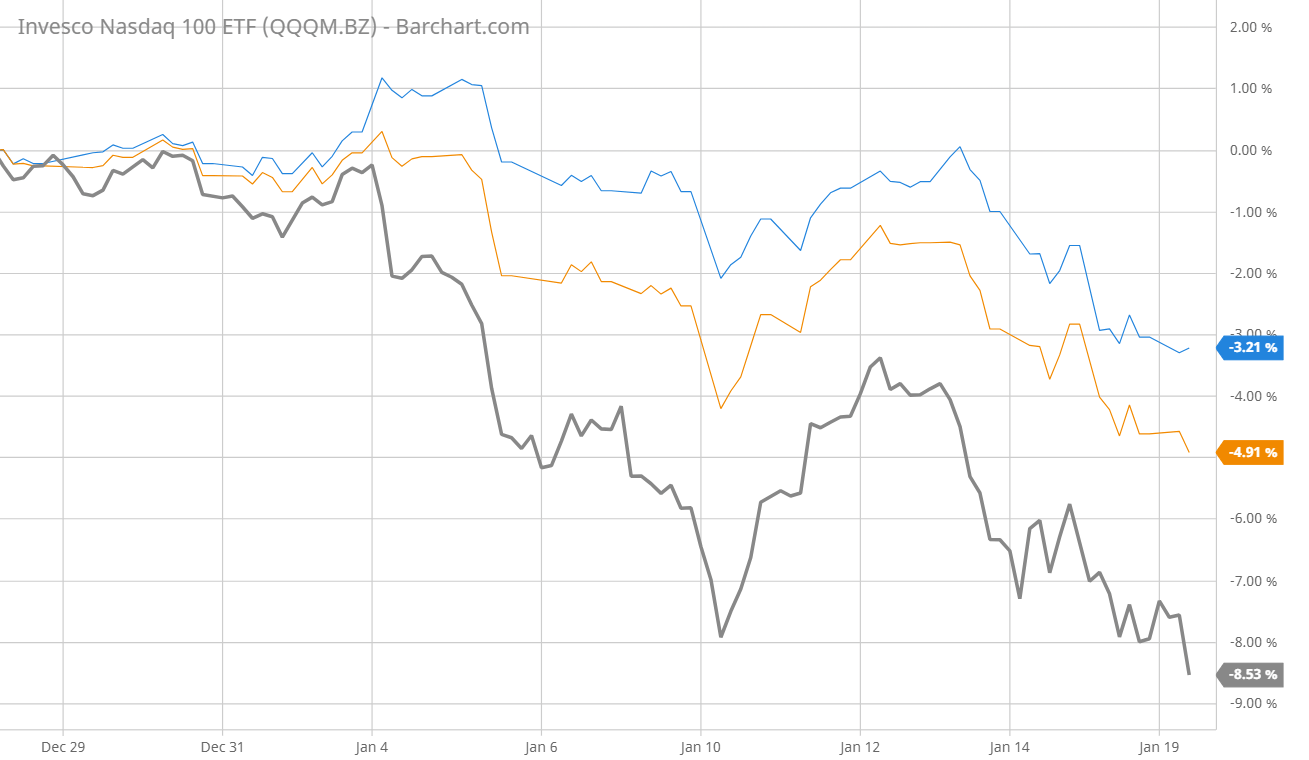
The dark line is the Nasdaq 100, which I’ve chosen because it represents the top tech growth stocks, down 8.5% so far this year. The Dow is down 4.9%, and the S&P 500 is down around 3.2% on an annualized basis.
Now, why is that happening?
Well, you know the story. Basically the relationship between interest rates and growth stocks is that it’s all about duration. Duration is the sensitivity of the present value of any asset to changes in interest rates. But here’s an interesting way to look at duration. I talked about it last week, but let’s revisit that. Technically, if you model duration, the way that most analysts see it is that if investment has a duration of 10 years, in other words, if the payout period, the time that it’ll take you to earn your money back on an investment is 10 years, then for every 1% rise in nominal interest rates, you would expect the price of that asset to fall by 10%.
That’s the discounting function of interest rates at work. So for example, in 2015, a long-term Treasury yield spiked by roughly 0.25%, not a big deal. But the S&P 500 shed 11% over the next 12 months. 11%, that’s actually a more severe sell-off than the duration model would expect. So the big question is: Where do we stand with duration now?
Well, the duration of the S&P 500 right now is at nearly 37 years at the end of 2021. Here’s a chart that shows that:
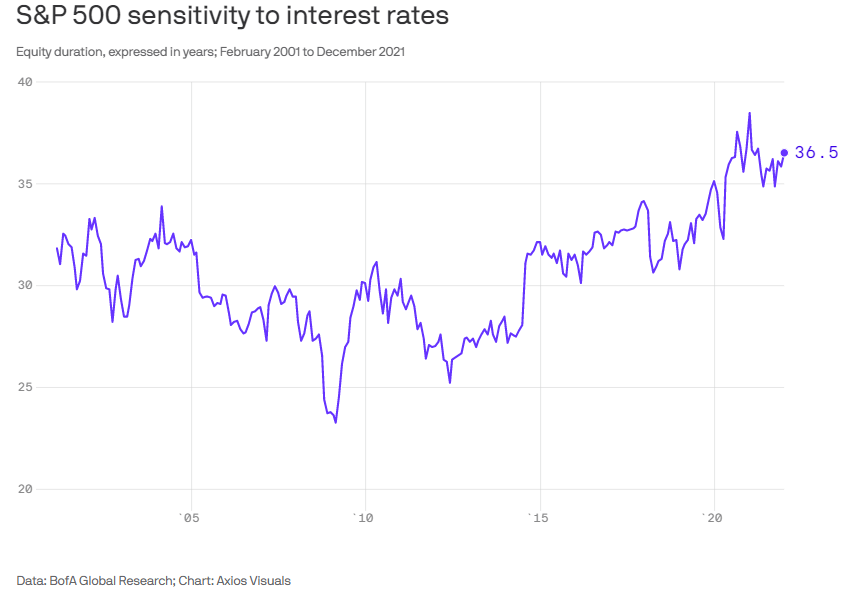
This goes back to the early decades or the early years of the 21st century. But essentially, we are at extremely high levels. Now, what that means is that if we were to see a 1 percentage point increase in real rates, in other words, the actual real yields, basically we would expect to see stocks lose about 37% of their value. Thirty-seven percent.
Now, that would wipe out all the gains that we’ve made in the last year and a half. The big question is, is that likely to happen? I don’t think it’s going to happen across the board, but it’s already happening to certain parts of the market. Here are two types of speculative investments that were popular over that last year and a half. The first one is my bet noir, the ARK Innovation ETF (NYSE: ARKK). And you can see what it’s done from 2017 until now.
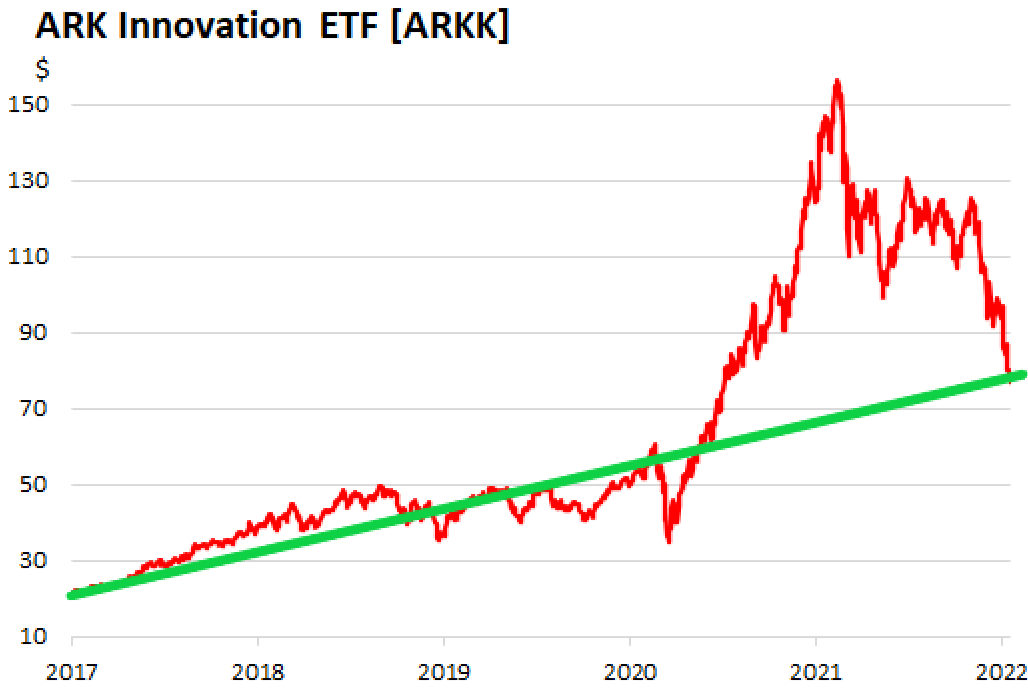
Now I’ve drawn a green line, which I think roughly estimates what the rate of growth of that ETF’s value would’ve been in the absence of the COVID crisis and the Fed intervention. So arguably, we could be at something like fair value over a long-term basis, but again, we haven’t seen the Fed tightening the way that it’s planning to tighten over this period.
So when you look at this chart, you think, “Okay, it’s back to more or less its trend line,” but remember, the higher interest rates go, the less valuable these stocks become because they’re such long duration. I mean, in some cases, the duration of these stocks are in the hundreds of years. So in the absence of just blind faith in some of these high-flying tech stocks, which is certainly out there, I mean, there’s a lot of Tesla fans who will pay pretty much anything for the stock. P/E doesn’t matter.
The big question is not whether we’re back to the trendline, but whether the trendline is going to shift because interest rates are going to be going up a lot higher than previously? Here’s the Renaissance IPO ETF. This essentially holds ETFs that have happened within the last couple of years:
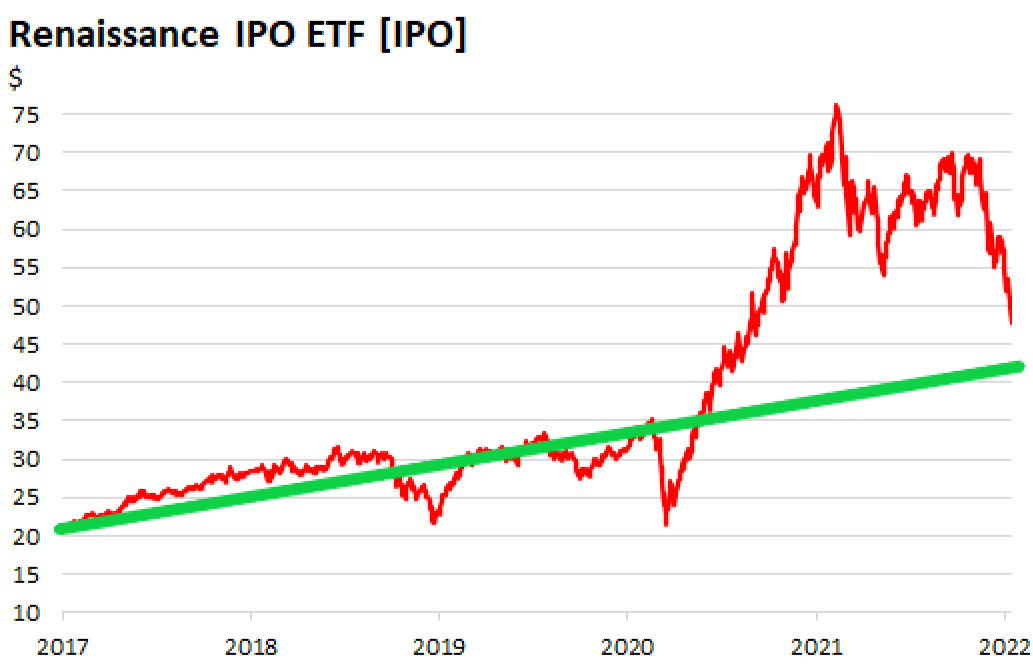
Again, I’ve drawn the trend line, even by this standards, this particular set of stocks, recent IPOs, companies such as Zoom and Airbnb and the Ubers and the Lyfts and the Grubhubs and all those, these are still overvalued, I think relative to trend. But again, if interest rates go up as strongly as they are likely to do, then we can expect even more pullbacks in these stocks. So the other question is why have we had so much volatility?
Here’s a chart that shows some of the big down days of the market.
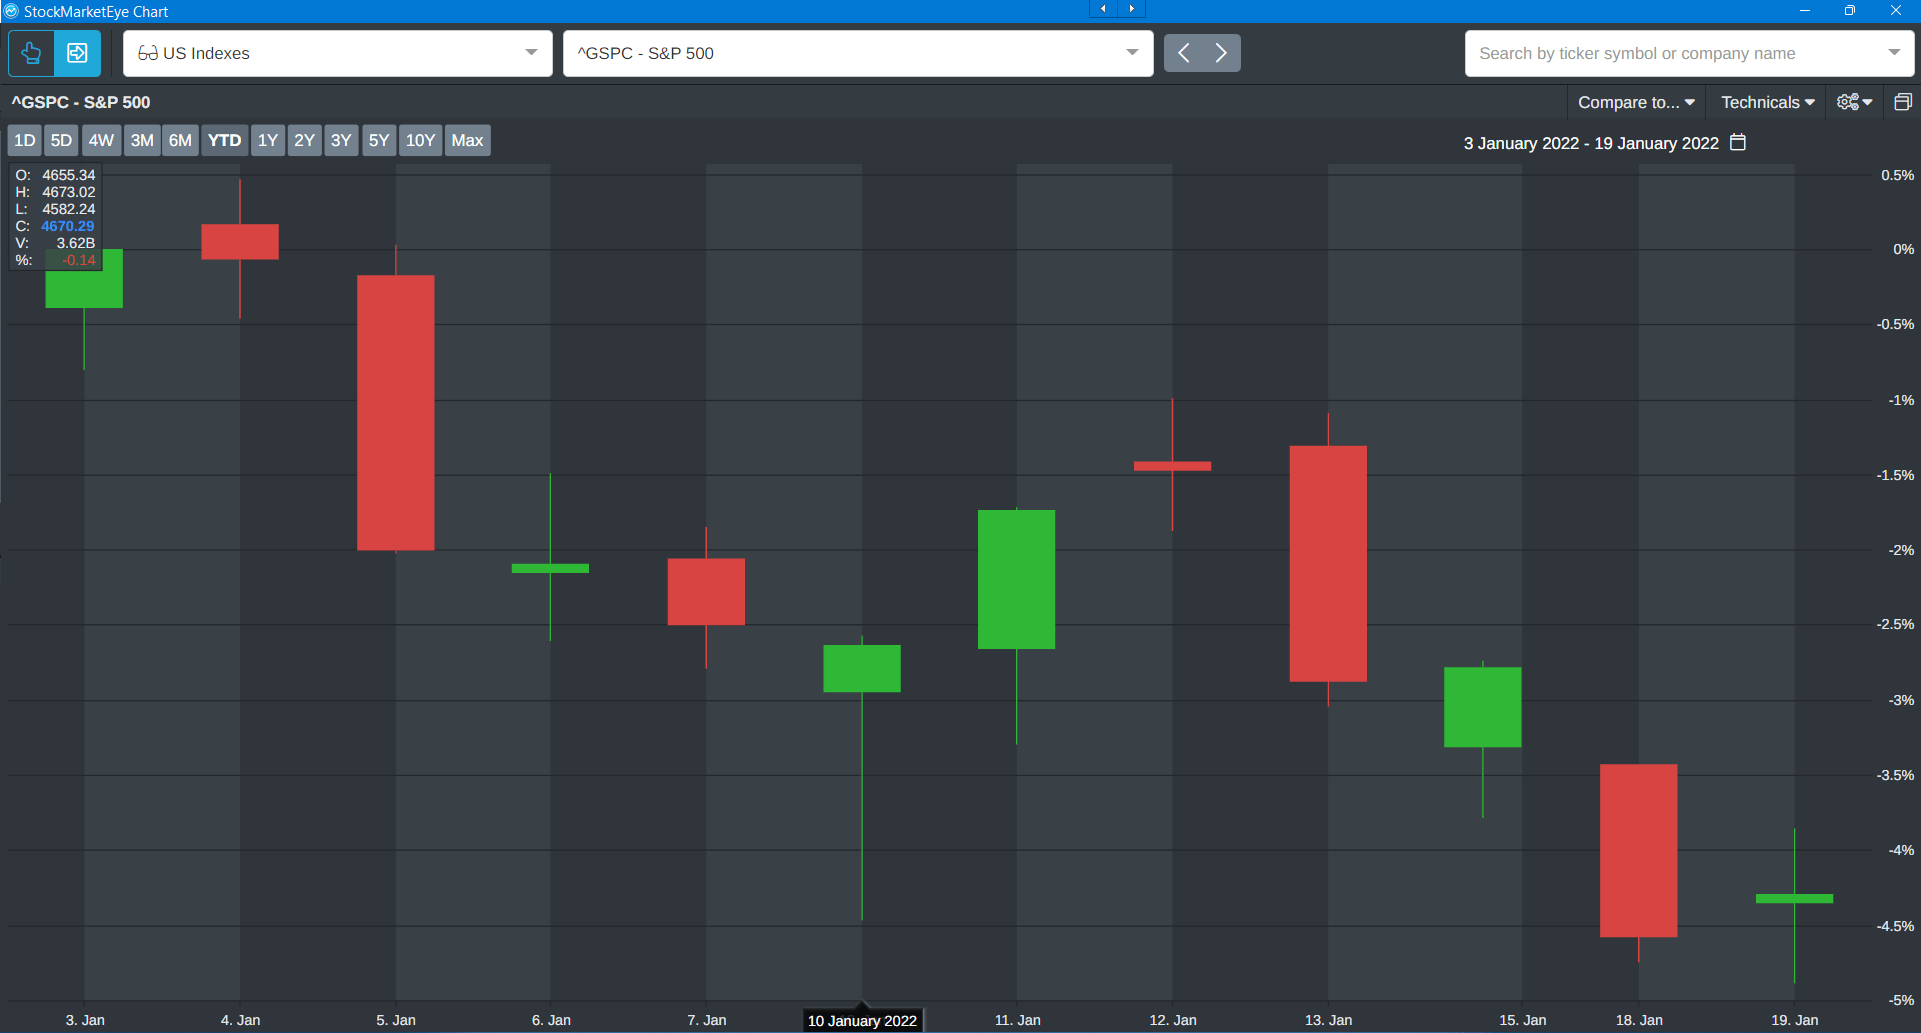
So on the 5th of January, the 13th and the 18th, that was yesterday, I’m filming this on Wednesday, big pullbacks. But also look at the 10th and the 11th, the market… I mean, the session lows were dramatically lower than where we ended up at the close. I mean, there were some huge intraday swings. So why is that happening?
Well, that takes us back to our old friend, “the volatility trade.” Now the volatility trade is basically about trading volatility in order to try to reduce, to achieve optimal risk balance in a portfolio. And it’s very popular with a certain segment of Wall Street quants.
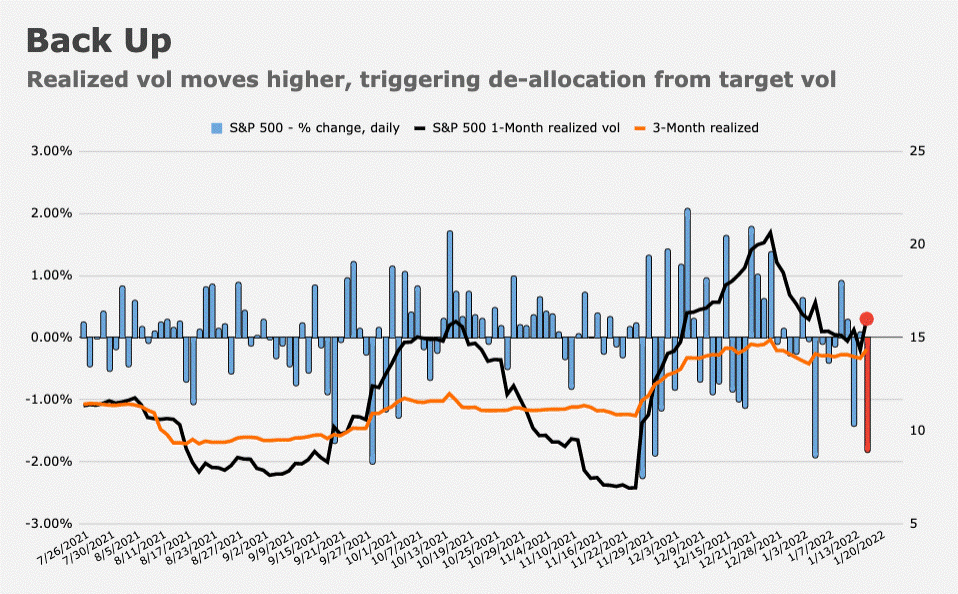
What tends to happen is that as realized volatility over one and three-month periods rises, that leads to a de-allocation. In other words, the volatility of what you’re holding is rising, so you sell it in order to rebalance your portfolio to have a better risk profile.
And that leads to massive swings. So we can expect a lot of volatility as stocks breach certain fundamental levels. Now, all of this isn’t just a U.S. issue. Here is the benchmark German Bund, the 10-year yield, it’s just breached zero.
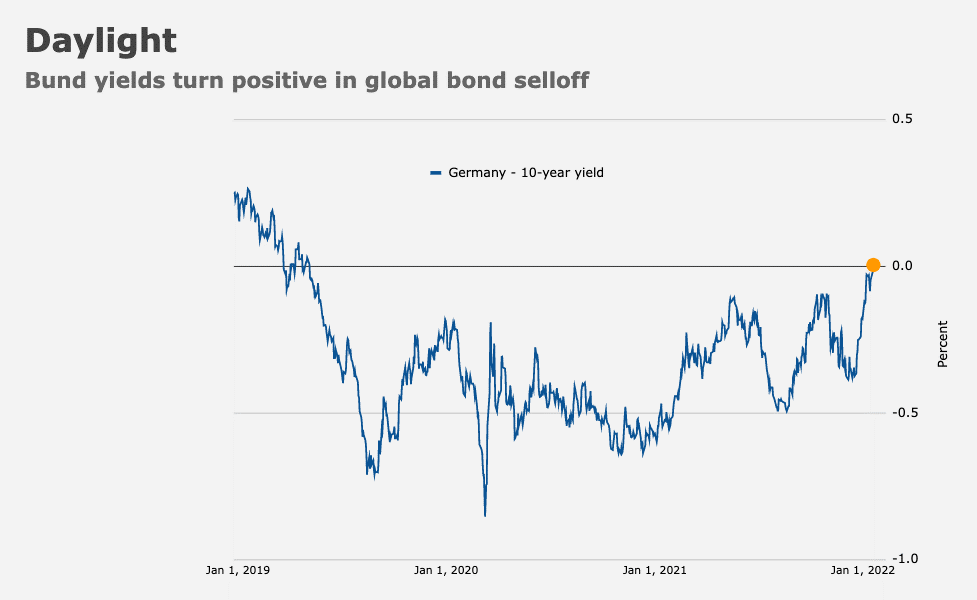
Interestingly enough, it was below zero even before COVID hit, but this is moving upward rapidly. And I think with German inflation and European inflation, you are going to see it rise quickly.
So here’s what European traders are doing, and I think we’re going to see something similar in the U.S.
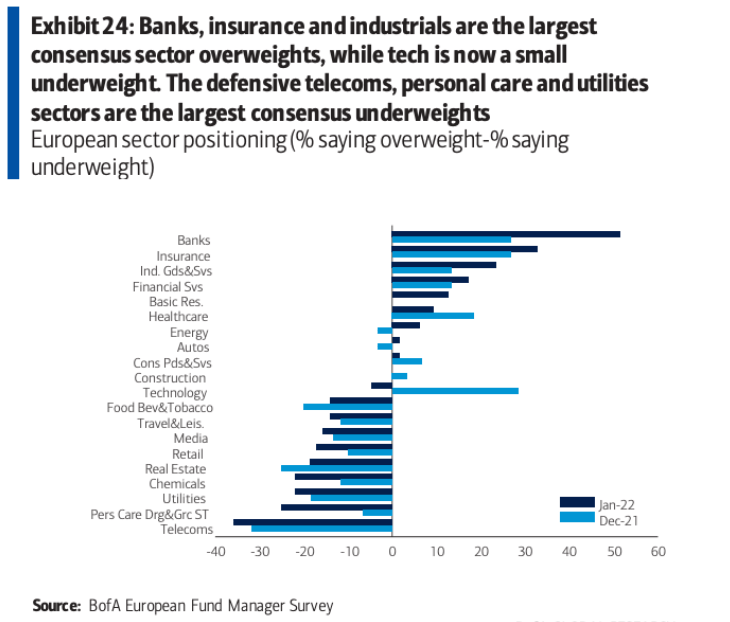
This shows the sectors that are consensus overweights. In other words, where they think people should be putting their money. And clearly at the very top, you’ve got all the financial stuff, banks, insurance, goods and services, also financial, so on, health care. A big jump in construction and technology.
But at the end of the day, I think the critical issue here is going to be what kind of technology. But basically, what we’re seeing is that people’s switch, like for example in technology in December, people were still overweight. Now they’re moving the opposite direction. So really the big question here is: What is going to happen to U.S. markets? Are they going to fall?
Well, here’s the reverse side of that. Here are the sectors that are basically overvalued.
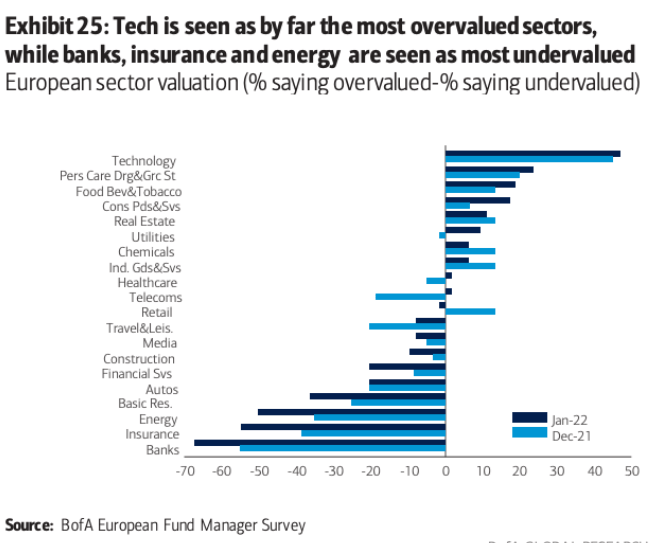
The ones that are overvalued, things like technology, real estate, utilities, food, beverage and tobacco, et cetera. The ones that are undervalued now are again, back into energy, insurance, banks, and so on, financial services. So all this suggests that if we do see this big move in interest rates, that people are now speculating that the Fed might even raise interest rates by a half percent, 50 basis points in its March meeting, which would be a real clap to the markets, as they say in South Africa. Who knows?
But clearly I’m on record as saying that I think the Fed is likely to use the opportunity, the threat of inflation, the excuse of inflation to rein in over-frothy markets, including the stock market. But I still think there’s a way to play things going forward and here it is…
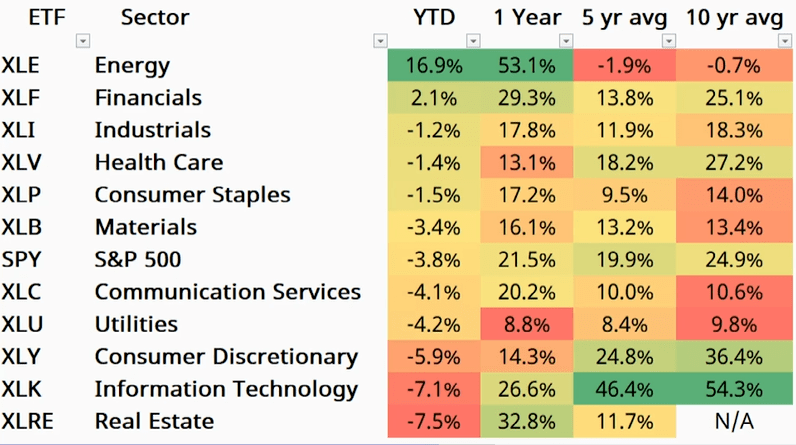
So here are the main sectors, by which the stock market classifies all companies. They’re all lumped into one of these. Obviously, the S&P 500, it’s got its own position there. I put it in there for reference. But this chart shows the year to date performance by sector, but it also shows performance going back one, five, and 10 years. Now, these are the average annual growth rates over these periods. So the first thing that jumps out is that going back a year, energy has been a huge leader. And obviously, that has to do with the fact that it got pushed down so much during the initial stages of COVID. Basically, people thought, “Well, that’s it, we’re not going to have any demand for oil or whatever.” And so people sold off those assets and, of course, they were dead wrong, and now everything’s bouncing back.
The next one that’s had pretty good annual returns these days, in fact, the only other positive sector is financials, but that’s come down a lot during the last week or so, because of really poor earnings reports from a lot of the major banks. They made a lot less money on trading in the last couple of quarters than they usually do, and that has compressed their margins. But also, higher interest rates means that they could face higher capital costs.
But let’s look at it from a one-year basis, and then just see who are the big winners. Well, again, it’s still energy, but look at how some of the losers have changed. Last year, real estate was a big winner, and a lot of that has to do with REITs, Real Estate Investment Trusts. This year, not so much. And I think the big reason there is, it’s a couple of things. One is that there is a general concern that interest rates will lead to higher mortgage rates, which will lead to lower sales in the housing sector, which I think is wrong. I’ve talked about that in previous videos. I think people fail to recognize that if interest rates go up, the price has to go down. And although that’s easier to do with existing homes than with new homes, I do believe there’s scope for cost containment in the home building industry.
But the other thing, of course, is in the REIT sector, people worry that higher interest rates mean higher weighted average costs of capital, which, again, I think is a mistake because they don’t understand that REITs generally plan out and ladder their borrowing over many, many years, and they lock in a low average weighted cost of capital over time. Anyway, that’s one of the big losers.
Financials, again, I’ve spoken about, but here’s the big one. Information technology, after having had a reasonably good year last year, basically down severely this year. The other one that’s down severely is consumer discretionary, after having had a reasonable, not outstanding, year last year, but okay, and that one’s down big time because obviously, people think, well, they’re not going to have stimulus cash. That stuff has run out, and they’re not going to be seeing that.
So now, let’s go to a five-year look at it and see what the story is here. Well, clearly the big winner over the last five years has been both information technology, and then a distant second has been consumer discretionary. Both of them beat the market, the average market return over the last five years, but both of those are big losers this year. So what we’re seeing clearly is a pretty big rotation away from those two sectors. And down here, a pretty big rotation into, back into, energy, which has been a five-year loser.
Take it back over a 10-year period, and you see something similar. Basically, those two, information technology and consumer discretionary, down. Also, healthcare down, and financials down, relative to their longer term performance. But again, energy over the short term, is certainly way outperforming the way it has in the past.
Now, what’s the point of showing all this? Well, I think there’s an interesting play that you can try to enact here. And that is, if you look at these things, you’ve got these ETFs over here. You know that they’re built around, essentially, all the companies that fall into those, into the S&P 500. They’re index ETFs, which means that you’re playing the whole index. And I think that there’s a pretty good play to be made this year by trying to identify which ones of these are likely to have momentum on a short term basis. Buy them, and then keep a close eye on the macro conditions and get rid of them once they’ve gone up. I mean, this is not a bad year-to-date game. I mean, that’s, if you think about it, I mean, what’s the S&P 500? I mean, you’re basically almost 20% relative to the S&P 500. I mean, anybody would like that kind of game.
So you buy that, you hold onto it until it looks like it tops. Right now, the oil price is pushing up to like 90%, or sorry, $90, and that’s because of problems. Obviously, as I’ve said before, I think if the Russians invade southeastern Ukraine, that would send prices skyrocketing. You’ve got issues in the Persian Gulf with the Yemeni Civil War spilling over into the Gulf itself, and that’s also putting upward pressure on prices, in addition to all the stuff, the demand from a rebuilding economy, if you like.
So I think that’s something you want to think about, is looking at these sectors. And they’re not going to stay static. I mean, I think you’re probably going to see changes. I mean, healthcare and industrials, I think, are ones that are poised to grow again as the economy begins to regain its footing. Right now, obviously, the biggest issue is still COVID. But as we come out of the omicron phase, which we’re told that it’s diminishing, caseloads are falling, you’re going to see things like materials and industrials, and even consumer discretionary, possibly, but certainly real estate, I think. All of these are going to start to recover at some point once the inflation expectations and the real estate expectations are baked in. So that’s an idea. I think it’s a way that, in the short term, keep an eye on these top level sectoral ETFs. Pay attention to what’s happening. And you can buy in and out of them, and generate and compound some pretty good earnings that way.
Well, that’s my argument for you. I know it’s not all exciting, but remember, the nice thing about these passive index funds is that they are an easily accessible way to track movements from sector to sector, rotation from sector to sector. And as I showed you earlier, when we look at some of the sectors, particularly that the European investors are thinking are going to be overweight and they’re going to want to move money in too soon, you can start looking at those ETFs and start looking for signs of that happening. We’ve already seen it happening in energy, but I do think at some point, we’re going to start to see some other sectoral ETFs pull up.
And if you watch them carefully, if you time your trades right, which means watching these things on a daily basis, trying to see when momentum turns, I think you could make some reasonable returns by compounding the gains that you made on a previous trade, sectoral trade by the gains that you make on the next one, as long as you keep your eyes open. Anyway, that’s Ted Bauman for this week. I’ll talk to you again next week. Bye-bye.
Kind regards,

Ted Bauman
Editor, The Bauman Letter