Senior Managing Editor’s Note: We’re excited to announce that Chartered Market Technician Chad Shoop is teaming up with fellow colleague and options expert Mike Carr.
Instead of hearing from Chad once a week through American Investor Today, you can hear from him and Mike several times a week in their new daily e-letter, True Options Masters. The best part is, it’s free! So, if you haven’t already, be sure to sign up for it right here.
Chad will go over his latest strategies, ideas, potential trades and more. You won’t want to miss it.
— Lina Lee
I’ll be the first to tell you that most of it is just for show…
I’m talking about charts. Plenty of “experts” try to make you believe that complex charts can give you a unique perspective on stocks.
You see, they can make charts look pretty cool. But they won’t tell you how their fancy charts usually only help everyday investors 1 out of 10 times.
Thankfully, I’ve spent a decade studying how to spot the ones that actually do work from the ones that don’t.
And today, I want to share one kind of chart that does work. It’s time-tested — and probably the first time you’ve ever seen one like it.
But I’ll show you how it can help you identify some of the best moneymaking opportunities out there, all year-round…
Introducing the Shakeout Rotation Chart
Take a look below:

(Click here to view larger image.)
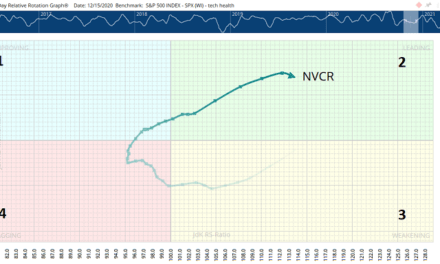
I call this my Shakeout Rotation Chart. And it tracks two of the most powerful technical indicators in the market — relative strength and momentum.
Relative strength tells us which stocks are outperforming their competitors. And momentum tells us whether or not the stock is generally moving higher or lower over the short term.
At first glance, it might look like a snake going nowhere. But with my years of experience, I can use this chart to identify some of the best profit opportunities in any market.
Now, the Shakeout Rotation Chart above is for NovoCure (Nasdaq: NVCR) during the end of last year. It’s a health care company working on treatments for certain types of tumors.
And as you can see, I’ve labeled four shaded quadrants. Here’s what they mean:
- Quadrant 1 (Blue): The stock is improving and is on an upswing.
- Quadrant 2 (Green): The stock is leading the market.
- Quadrant 3 (Yellow): The stock is weakening, since it can’t go up in a straight line forever.
- Quadrant 4 (Red): The stock is in “Shakeout Territory” — it’s lagging the market.
So, the chart above is actually showing a natural rotation for NovoCure’s stock.
Now, I only track the strongest, highest-quality stocks. And they all cycle through this rotation day in and day out. They go from leading to weakening to lagging to improving … and then back to leading.
Of course, the best time to profit from them is when they’re lagging.
That’s why, when I see one of these stocks move into Quadrant 4 (Shakeout Territory), I know it’s time to strike. And you should, too…
Take Advantage of Year-Round Opportunities
The time to strike on NovoCure has passed for now.
But it’s still a great example of how the chart can lead you to profits.
Take a look at the chart below. It tracks NovoCure’s price over the end of 2020, the same time it went through the rotation in the previous chart.
I’ve highlighted the prices based on the color of the quadrant the stock was in at the time.

(Click here to view larger image.)
Remember…
- Blue = improving.
- Green = leading.
- Yellow = weakening.
- Red = lagging.
As you can see, NovoCure’s share price followed this natural rotation perfectly.
If you’d invested in the stock when it was in Shakeout Territory (red), you could’ve seen a 40% gain in less than 60 days as it went on to improve (blue) and then lead (green).
And if you used my special Shakeout Strategy, you could’ve boosted your returns even more — seeing potential gains of up to 400%.
But this is just one of many opportunities my Shakeout Rotation Chart pinpoints throughout the year. Many more are on the way. And that means you could lock in these kinds of triple-digit gains every month.
I’ve put together a special presentation to show you how you can join me in spotting trades like this right away. All you have to do is click here to learn more.
Regards,

Editor, Quick Hit Profits