Value investing is both the most intuitive investment strategy … and the simplest to explain.
You try to figure out what an underlying business is worth, and if its stock is trading on the open market for less than that price, you buy.
Your expectation is everyone else in the market will eventually “come around” and agree with you. They too will buy the “underpriced” shares until the market price matches the “fair value.”
If you buy shares at a 30% discount, your profit is 30% once the gap is closed. Pretty simple, right?
Well, believe it or not, buying options works pretty much the same way. And in many cases, it’s easier to establish a “fair value” price for an options contract than it is for a public company.
You might not trade options, or care to even start. In fact, a recent survey we put out indicates precisely that.
But as a 20-year options veteran who swears by their utility, I’ll stick my neck out anyway and tell you now is exactly the right time for you to get comfortable trading options.
You see, options are the ideal form of portfolio insurance. We haven’t seen policies so cheap in over three years… And I think it’s the perfect time to go shopping.
I understand there’s a learning curve here. That’s why I’m taking you to the heart of the options market and demonstrating how you can spend a relatively small amount on an insurance policy that could save you from a stock market wipeout…
The Value of Portfolio Insurance
The mispricing of portfolio insurance — aka put options, more on that later — boils down to a single metric: volatility.
You’ve no doubt heard of the “VIX” — the Volatility Index. But if you never quite understood what it is or does, here’s the simplest explanation:
The VIX is a measure of how volatile investors expect stocks to be over the next 30 days.
If the VIX is high, it means investors expect stocks to be very volatile. If the VIX is low, investors expect stocks to be only a little volatile.
This is where the VIX’s “fear gauge” nickname comes from. Since the vast majority of mom-and-pop investors hold retirement portfolios full of stocks, expectations of high stock price volatility are a scary thing.
Analysts like to say “investors seem complacent,” when the VIX is low. This is because a low VIX reading indicates investors are not expecting high levels of stock price volatility. More poignantly, they don’t think stocks will crash anytime soon.
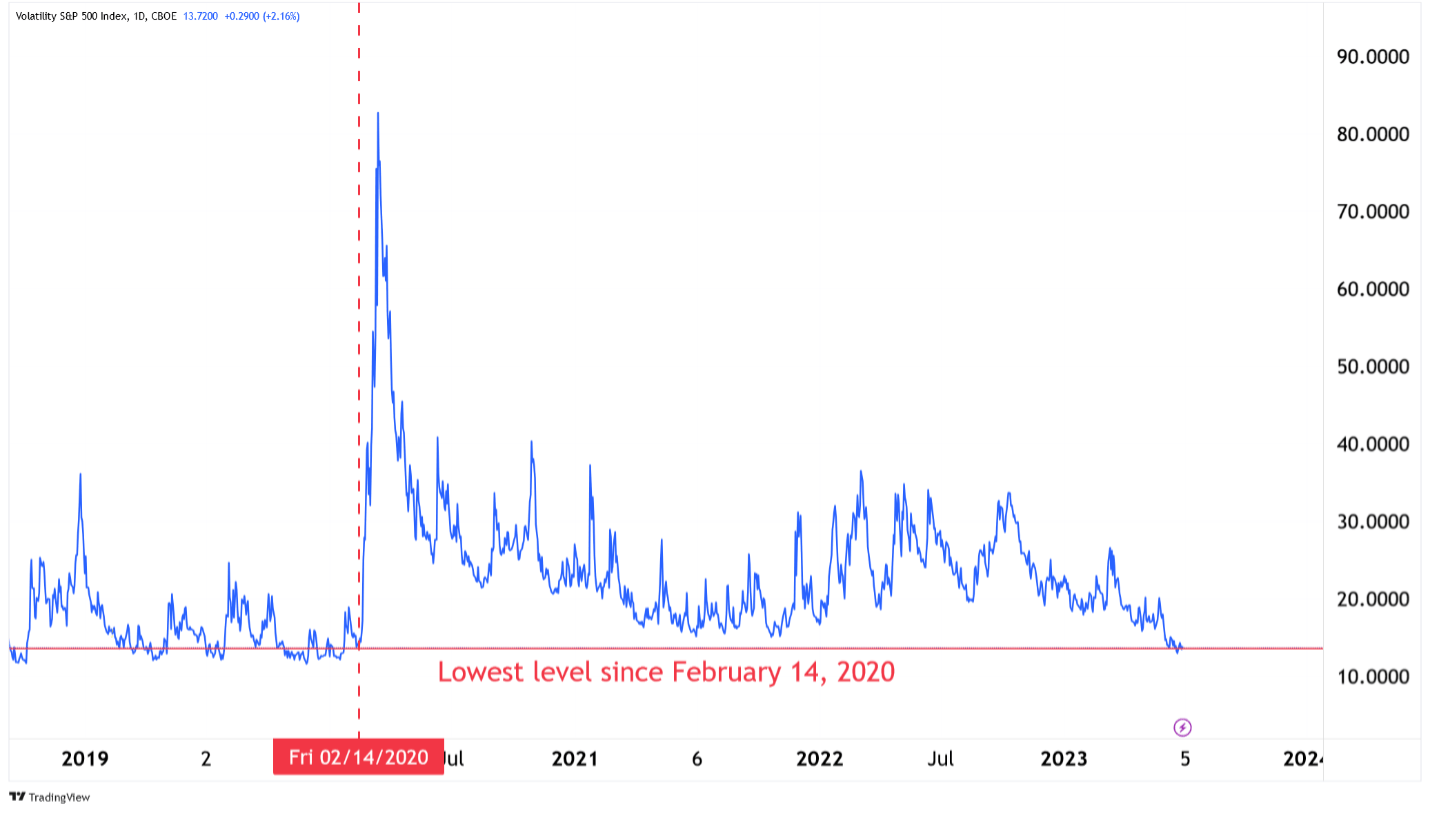
Now, with that in mind… Where’s the VIX at?
It just closed at the lowest level since February 14, 2020. This means investors are more complacent and less fearful today than they were right before the pandemic.
Take a look.
Here’s why this is so weird…
When experienced investors are concerned about stock market volatility, their appetite for “portfolio insurance” grows. That protection comes from buying put options, which are designed to increase in value when stock prices fall.
When these investors become increasingly worried about a stock market correction or crash, they become willing to buy put options at higher and higher prices, which in turn shows up in high VIX readings.
But we’re not seeing any of that today. Nobody is spending money on “insurance protection” for their stock portfolios!
My team and I recently crunched some numbers on the VIX’s history, which goes back to 1990.
We found that based on weekly closes, the VIX has been below its current level (13.44) only 22% of the time. Meaning, 78% of the time over the past 33 years … the VIX has been higher than it is today.
What we also found interesting is how unusually fast the VIX fell to historically low levels following the 2022 bear market.
For reference, the dot-com bear market officially ended in September 2001, yet investors remained fearful for an additional three years — the VIX didn’t fall below 13.44 until October 2004.
The same pattern played out following the 2008 financial crisis. That bear market ended in March 2009, but investors remained fearful for nearly four more years — the VIX didn’t come down to 13.44 until January 2013.
Meanwhile, the 2022 bear market ended last month … and the VIX has already fallen to historically low levels!
This could mean one of two things.
- Today’s low VIX level could be a contrarian signal — along the lines of Warren Buffett’s famous saying: “Be fearful when others are greedy.”
Everyone and their brother seem to have jumped on the artificial intelligence bandwagon with record speed, and nobody is interested in paying up for protective put options. This indicates a moment of sentiment that certainly feels brazen and greedy.
What if those folks are wrong? The answer is … the market could unravel in a hurry.
- On the other hand, the VIX’s return to historically low levels could mark the beginning of a new, sustainable, multiyear bull
That’s because, historically, long stretches of VIX readings below 13 or 14 have coincided with bull markets in stocks. Notably, the VIX was below 13.50:
- For 129 weeks between 1990 and 1996 (bull market).
- For 101 weeks between 2004 and 2007 (bull market).
- For 171 weeks between 2013 and 2020 (bull market).
The question becomes: Will today’s low VIX reading be short-lived, and soon revert higher? Or is it the start of a new, sustainable, long-term trend of low volatility and higher stock prices?
The answer, frankly, is no one knows. Even the “value investor” with the intuitive strategy we talked about earlier.
After establishing the “fair value” of a company and seeing its stock price trade at a 30% discount to it … what if the company’s true value deteriorates over the following year?
It’s impossible to know the future, and no strategy wins all the time … but value investors routinely put the odds in their favor by buying stocks that seem to offer a large discount to their fair value.
And we can do the same thing with options…
Valuing Portfolio Insurance
Generally, buying put options when the VIX is low gives you a margin of safety that’s similar to buying a stock below fair value.
I’ve shown how the VIX is currently reading about 13.50, but over the past 33 years, the VIX has averaged 19.5.
This means you can effectively buy options contracts today for a roughly 30% discount.
If a particular put option on the S&P 500 is trading for $700 today, based on the VIX at 13.50 … it could be worth around $1,000 if/when the VIX mean reverts higher to its long-term average of 19.5. (That’s purely accounting for the volatility component — the S&P 500’s corresponding move affects the price too. But that’s a story for another day.)
So by spending $700, you’ve bought a portfolio insurance policy that will return at least $300, likely much more, in the event of a simple reversion to the VIX’s long-term average.
Buying put options when the VIX is historically low definitely puts the odds in your favor … but it’s far from the only thing to consider.
If you buy a call option (a bullish bet), you really want to see the stock’s price rise over your holding period. And if you buy a put option (a bearish bet), you want to see a declining share price.
That’s why you can’t just fire up your brokerage account and start buying any options contract you see. You need a proven system for projecting whether stocks will go up or down.
And that brings us back to my 20 years of experience trading options…
Learn to Love the Options Market
Listen, I’m not gonna pretend that learning everything there is to learn about the options market is easy.
But understand … you don’t need to learn everything to make money trading them.
In my Max Profit Alert service, I distill decades of options study and practice into a set of simple-to-follow instructions.
In each recommendation, I share in simple terms exactly why each trade makes sense. Then I give you the precise moves to make to take advantage of the trade in your brokerage account. (Once you do it a couple times, you’ll realize it’s hardly any different from buying or selling stocks.)
To be clear, my strategy is not just buying put options when they’re cheap. We hold bearish positions on assets we think will lose value (like certain automakers and troubled banks) … and bullish positions on assets we think will rise (like the trade I just recommended three days ago on a rapidly recovering industry).
But above all, members of Max Profit Alert learn to use this highly misunderstood and shunned financial tool for themselves. That kind of education is worth so much more than any single trade can provide (OK, let’s be real, most single trades).
Both the links above will take you to recent presentations of mine that show how the strategy works in different contexts. Check them out and see what they have to offer.
But no matter what you decide, consider learning a thing or two about using put options as portfolio insurance. You don’t want to be caught on the wrong side of a big volatility surge without it.
To good profits,
 Adam O’Dell
Chief Investment Strategist, Money & Markets

The Fed Is On the Move
The first quarter GDP growth numbers were just revised higher to 2%. New home sales are picking up, and even factory orders are starting to show signs of life.
If we do get that recession we’ve been warning about, it’s looking like it won’t be starting tomorrow.
That’s good news, of course. Recessions certainly aren’t fun. But all of this newfound economic strength does make one thing all the more likely:
The Federal Reserve will be issuing more rate hikes.
As I mentioned yesterday, Fed Chairman Jerome Powell is trying to “jawbone” market expectations. And it seems that investors are paying attention.
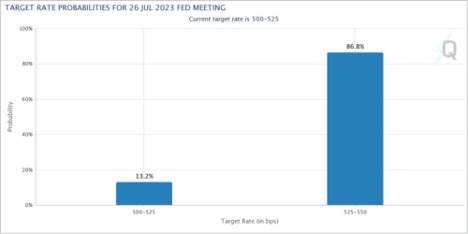
The Chicago Mercantile Exchange’s FedWatch tool uses the action in the futures market to imply the probability of a rate hike.
This tool is now showing an 87% probability that the Fed raises rates next month.
Again, this isn’t all bad. If the Fed feels comfortable raising rates, it means that the economy is strong and they’re not worried about pushing us into recession. Great!
But let’s remember why the Fed decided to pause its rate hikes in the June meeting. Powell & Co. were legitimately worried that the recent string of bank failures was at risk of sliding into something deeper and harder to contain.
So far, that hasn’t happened. Fortunately, we haven’t had any additional banking blowups either.
But we should also remember what caused Silicon Valley Bank, and other banks like it, to crumble in the first place.
It was the Fed’s unprecedented tightening (and the general surge in bond yields) that caused those banks in question to take large losses on their bond portfolios.
Now, not every bit of good news has a nasty caveat.
Sometimes good news is just good news. And I’ll take the stronger-than-expected GDP growth as a positive. But it still makes sense to stay flexible and to keep your risk management in place.
Take advantage of this buoyant market. But know your exit strategy before getting into any trade.
Adam has always done a good job of this. His disciplined approach has allowed him to survive and thrive over his career as a trader, even as we’ve lived through one crisis after another.
He actually sees a unique investment opportunity in the recent banking crisis. For example, a perfectly timed trade against Silicon Valley Bank would have generated 75,900% profits in less than 100 days.
And now, there are 282 banks are at “high risk” of collapse — according to his latest report. If you want to find out more about how you can protect your wealth, and make sizable profits doing it, go here to watch his free webinar.
Regards, Charles SizemoreChief Editor, The Banyan Edge