
Many people believe stock market prices are usually “correct.”
The Efficient Market Hypothesis (EMH) says that, since everybody has access to the same information about a company’s performance, its stock price shouldn’t remain over- or underpriced for long.
Try telling that to someone who bought a high momentum stock in late January last year.
Here’s a random example: remote medicine startup Teladoc Health (NYSE: TDOC):
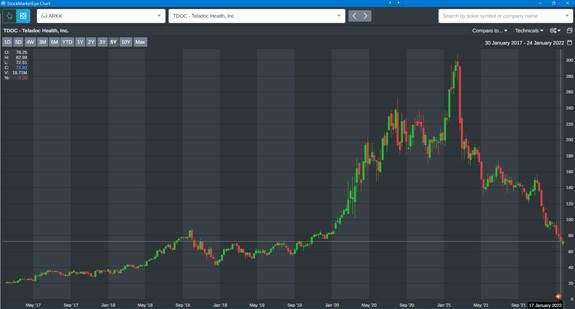
(Click here to view larger image.)
The stock saw some early appreciation after its initial public offering (IPO) in 2015. It hit a peak in late 2018, then traded in a range until COVID struck.
After that, it went parabolic … practically straight up.
It cooled off a bit for the rest of 2020. Then went parabolic again during the meme-stock frenzy in January 2021.
Since then … not so much. TDOC is down 76% from its peak.
I’d say that’s solid evidence that the EMH isn’t always a good guide to investing.
Interestingly, however, TDOC’s current price is at the high end of its pre-pandemic range. That illustrates a critical concept in investing … and opens the door to a better way to look at markets.
How Long Is Long?
TDOC’s return to its earlier price level is an example of “mean reversion.” That is, over long periods, a stock’s price will change predictably based on objective factors such as revenue and profit growth.
It’s entirely possible for that price to go way above or below the long-term trend. But eventually it will return to that trend.
That suggests the EMH is right … but only in the long term.
In the short term — say, the period since the beginning of 2020 — the EMH is useless.
Stock prices move all over the place. But fundamental indicators like revenue and profit margins have nothing to do with it.
It’s no secret why prices went parabolic after the COVID crash in March 2020. The Federal Reserve made it crystal clear it was going to protect financial markets. It slashed interest rates to zero, making future earnings more valuable today. It flooded markets with liquidity.
Congress handed out stimulus payments and relieved suffering households of their repayment obligations for things like housing and student loans.
The result was an army of investors, flush with cash, stuck at home with nothing better to do than play the stock market.
Most of those investors weren’t paying attention to things like earnings and profit. They saw prices rising and didn’t want to miss out.
Momentum took over.
The EMH went out the window.
The Bad News for Momentum Traders
What would happen if long-term mean reversion happened to the whole stock market?
The chart below shows the S&P 500 going back to 1990. I’ve drawn a green line to show an approximate long-term growth pattern — the mean:
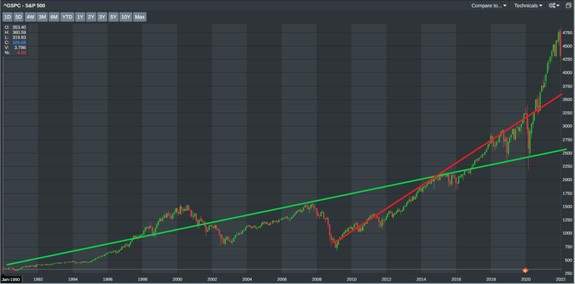
(Click here to view larger image.)
I’ve also drawn in red another potential mean for the index. It starts with the market bottom during the Great Financial Crisis and traces through yesterday.
That second trendline covers the period of the Fed’s unprecedented quantitative easing (QE) policy.
That’s the very policy it’s planning to reverse, probably starting today.
That chart is bad news for momentum traders.
If the market reverts to the trendline established during the QE period, we’re looking at a 20% to 25% collapse from its December highs.
But if it reverts to its long-term, no-QE mean, we’re looking at a collapse of 45%.
Someone will object that things would look very different using a logarithmic scale, which reflects long-term trends more accurately.
Unfortunately, from that point of view, the news isn’t any better. We’re still well above the mean:
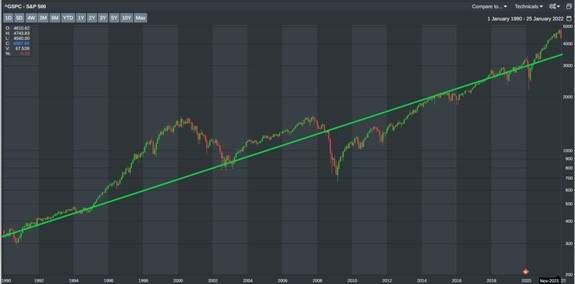
(Click here to view larger image.)
Survival of the Fittest
The EMH isn’t the only theory of stock market pricing. There’s another one called the Adaptive Market Hypothesis (AMH).
The AMH says investors behave like living species.
Most of the time, they’re focused on the short term. They try different strategies. When they find one that seems to fit the situation, they get attached to it. It becomes part of their investor DNA. Since it served their stock market survival needs so well in the past, they’re reluctant to change it.
But situations change.
With perfect hindsight, it’s clear that the stock market’s COVID momentum phase ended in the first quarter of 2021. But because it’s not always easy to see a new situation as it emerges, many of us — including me, for a while — tried to stick with what worked before.
Starting in the summer of last year, I decided to adapt to changing conditions and evolve my strategy.
I stopped recommending momentum stocks to my Bauman Letter readers. I recommended quality and value instead.
That’s because I believed that even though quality/value stocks might underperform the broad market for a while, eventually the market would pull back.
Inflation and rising interest rates would eventually drag down the handful of top stocks that had sustained the market for most of 2021 … hiding the carnage underneath.
Quality and value, on the other hand, would keep going up. I’m on pretty solid ground in believing that.
Over short time frames, momentum drives stock gains as investors are willing to bid up stocks to new price-to-earnings multiples. But over the longer term, the only thing that really matters is whether a company is growing its revenue and its profits:
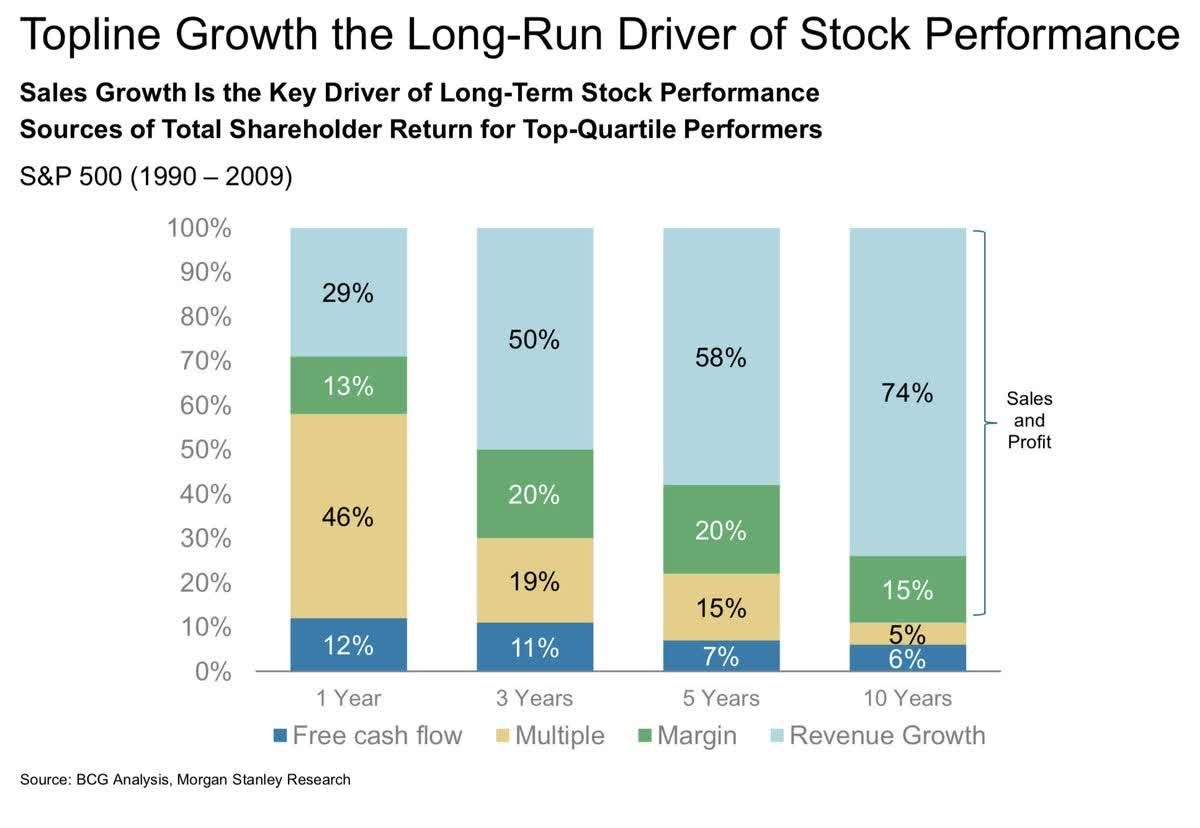
(Click here to view larger image.)
Adapt or Die
Back in the 1950s, Federal Reserve Chairman William McChesney Martin, Jr. said its job was to remove the economy’s punch bowl just as the party was getting started.
For more than a decade, the Fed has kept refilling the punch bowl.
What we’re seeing in the market right now is a panicked rush for the exits in sectors of the market that depended most on the punch.
But that’s by no mean the end of investor profits.
All we must do is adapt to a market with less punch.
And that’s exactly what my latest Bauman Letter pick does! Click here to read it.
Kind regards,

Ted Bauman
Editor, The Bauman Letter


