
I have a game for you this week…
Let’s pretend you’re shopping for a new house. On a sunny Saturday your realtor shows you three that were just listed.
They’re identical, inside and out… except for the color.

One is white, one is grey and one is beige.
Your realtor tells you the white house is asking $500,000, the grey house is asking $600,000, and the beige house wants $700,000.
Which house would you prefer to buy?
It’s not a trick question. It’s how I plan to teach my 2-year-old son about value investing as soon as he’s able to talk.
At the heart of it, “value” measures the degree of difference between two things:
- What you pay,
- For what you get.
If you pay a lot, but only get a little … you’re getting a bad deal.
If you pay a little, but get a lot … you’re getting a good deal.
It really is as simple as that.
You should want to buy the white house for $500,000 because, besides the trivial and economically unimportant variable of paint color, you’re getting the same house no matter whether you buy the white, grey or beige one.
The only difference – and the crux of your decision-making process – is the price you pay. And paying less is always better, all else equal.
And never was this lesson on value timelier than over the past three years…
2020-2022: The Value Premium
There were a lot of 2-year-olds in the market in 2020. They were fueled by COVID-19 stimulus checks, an excess of free time … and Reddit.
They couldn’t have cared less whether a stock was trading at a fair valuation. So in 2020, investors actually got penalized for buying the market’s cheapest stocks, and rewarded for buying its most expensive ones.
Have a look:
2020: Expensive Beats Cheap
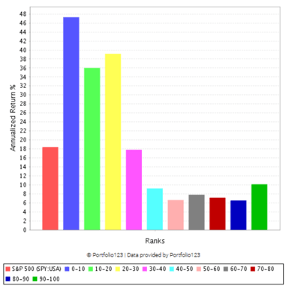
This chart shows the 2020 performance of the “value” metric of the stock ratings system I developed.
The tallest blue bar on the left shows the 2020 return of the market’s 10% most expensive stocks – 47.3% in a single year! And keep in mind, this was the same year stocks collapsed in the wake of pandemic shutdowns.
The bars on the right show the performance of the market’s cheaper “value” stocks – they all lagged the S&P 500 (red bar, far left), which returned 18.4% that year.
It was a mania, of course … and it didn’t last.
Folks came to their senses in 2021. No longer were they willing to buy the market’s most expensive stocks at nosebleed valuations.
Pricey stocks crashed. And “value investors” were rewarded for buying only the market’s cheapest stocks…
My friends, this is what the chart for the value factor is supposed to look like:
2021-Present: Cheap Beats Expensive
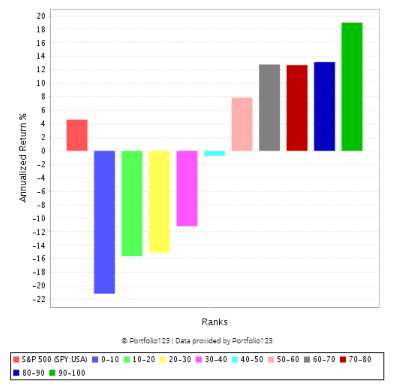
The green bar on the far right shows the 2021-present performance of the market’s 10% cheapest stocks.
You could have earned 19% per year since January 2021, had you bought the market’s cheapest stocks … which absolutely crushes the S&P 500’s return of 4.6% per year over the same time.
Also, note the blue bar on the left side – this shows the worst performance came from the market’s most expensive stocks, which so far have lost 21.2% per year.
So the 2-year-olds are blown up and the adults are sitting pretty. You might be saying: “That’s great and all … but hindsight is 20/20. Where were you in 2021 when I needed this?”
Well, for one … I never got caught up in the pricey stock game.
I was busy recommending high-quality stocks, including value stocks, in my flagship newsletter, Green Zone Fortunes. More on that in a minute.
But the more important question is this … “Will ‘value’ continue to outperform?”
2022–2025: Buy Value Stocks and Outperform
In a word … yes.
I believe “value” will absolutely outperform the market over at least the next three years.
And here’s why …
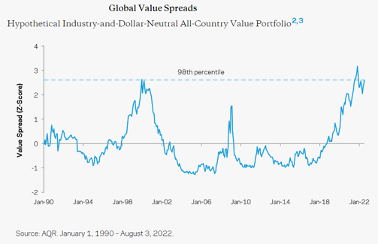
This chart shows the relative valuations of “expensive” stocks versus “cheap” stocks.
When the line is moving higher, expensive stocks are getting even more expensive … and cheap stocks are getting even cheaper.
Just look at what the chart did between 1994 and 2000, during the dot-com bubble.
Back then, expensive stocks got so expensive … and cheap stocks got so cheap … that the spread grew larger than any other time in history.
In statistical terms, the spread reached the 98th percentile. In layman’s terms, it reached an unsustainable “extreme.”
Of course, it didn’t last. Once the bubble popped in late 2000, the market’s most expensive stocks got absolutely obliterated. And “value” stocks began an epic run of outperformance, which lasted from roughly 2000 to 2006 (as shown by the declining line in the chart above).
Now let’s talk about what this relationship has looked like over the past few years, and what I expect it to do over the next three-plus years.
First, you can see a dramatic increase in the spread beginning in 2018. This shows how between 2018 and 2020, expensive stocks got more expensive and cheap stocks got cheaper – a classic, tell-tale sign of a late-stage bull market bubble.
Then, after blowing past that 98th percentile level we hadn’t seen since the dot-com bubble, the spread turned lower.
Expensive stocks got cheaper, because they sold off … and value stocks got a little less cheap, because smart investors started buying them.
Though, the most important thing to note is that the spread is still hovering around the 95th to 98th percentile.
Even though “value” stocks have outperformed strongly over the past two years … they’re still far cheaper than expensive stocks, relative to historical norms.
Said another way, value stocks are still very likely to outperform the market for several years to come.
Here’s how I suggest you play it …
How to Find Value in a Pricey Market
Realize, I’m not saying you have to sacrifice “growth” or “quality” or any of the other characteristics of companies and their stocks that drive market-beating returns.
I’m just highlighting the role that valuations play in your performance because, now more than ever, buying stocks that are reasonably to cheaply priced is working.
In my Green Zone Fortunes newsletter, I’ve built a portfolio of stocks that are well-rounded on each of the six factors my stock rating model is built on:
- Momentum
- Size
- Volatility
- Value
- Quality
- Growth
I’m willing to recommend stocks from any sector, so long as they rate highly on these metrics.
Though in recent years, I’ve found some of the most compelling value opportunities in the energy sector.
In March 2021, I recommended an oil and gas exploration company called Civitas Resources (NYSE: CIVI).
The stock was dirt-cheap at the time … it rated 99 out of 100 on my system’s value metric, meaning it was more cheaply priced than all but 1% of the market’s stocks.
Now, you might think a stock that that cheap will end up being more of a landmine than a big winner. But my rating system showed me that we would not be sacrificing quality or growth if we bought the stock. It rated 83 out of 100 on quality, and 87 out of 100 on growth.
Long story short, I recommended the stock in March 2021 and, including dividends, it’s returned more than 120% for us in just two years.
And get this … it’s still a great value!
Today, the stock rates 97 out of 100 on value, and 93 out of 100 overall.
That’s because even though the stock’s share price has more than doubled since I recommended it …
Civitas’ earnings per share have increased three-fold in the last year, and its free cash flow has grown five-fold.
That brings us back to my 2-year-old’s explanation of value investing – the relative difference between what you pay and what you get.
With Civitas, you’re now paying roughly twice the share price my Green Zone Fortunes readers paid for the stock in March 2021 …
But what you get for that price is ownership in a company that’s now generating three-times more earnings and five-times more free cash flow.
That makes it a great value!
If you’re interested in learning more about Civitas, the company just reported earnings on Wednesday – here’s a direct link to the company’s investor relations page.
You’ll see the company just raised its dividend, which doesn’t surprise me in the least given the cash flow its generating!
If you’re interested in a respectable and growing dividend, the next one will be paid out on March 30 to shareholders who buy on or before March 13.
Now, you must understand that whatever you choose to do with this information is up to you. Out of respect for my Green Zone Fortunes readers, I have to reserve my regular updates on the stock and specific price guidance for them. (If you’d like to become one of them, of course, I welcome you with open arms.)
But this stock is one of the best value names I can find, and it also happens to be part of my big idea that oil stocks are in the early stages of a long and strong bull market.
No matter what you do next, I implore you to invest with a keen eye for value right now. You’ll be happy you did come 2025.
Regards, Adam O’DellChief Investment Strategist, Money & Markets
P.S. Want to know the simplest way to check if a stock you hold is a good value?
Go to MoneyandMarkets.com, click the search bar in the upper right, and type in the ticker. My Stock Power Ratings system will rate your stock on six market-beating metrics, including value… completely for free.
Go ahead and look up your top holding, then write me at BanyanEdge@BanyanHill.com with what you learn.
Skinning the Value Cat

Like Adam, I let the data speak for itself. And the data is clear…
Value investing, if done consistently in a disciplined manner, works. Especially right now
But how do you define value?
If there was a simple answer, everyone would do it and it would stop working.
The truth is, there’s a lot of ways to skin this cat. You have to look at a stock from lots of different angle, unique to what that stock or sector does, to get a clear valuation picture.
Let me show you just one such method…
For our purposes today, let’s keep it general with a “mainstream” stock. I’ll use Disney (DIS) as an example. It’s a stock I’ve owned for years and have no immediate plans to sell.
The price/earnings ratio is a bit of a mess for Disney right now. Earnings collapsed during the pandemic, and even now their movie business has yet to get back up to pre-pandemic speed. So, let’s take a look at the company’s price/sales (P/S) ratio.
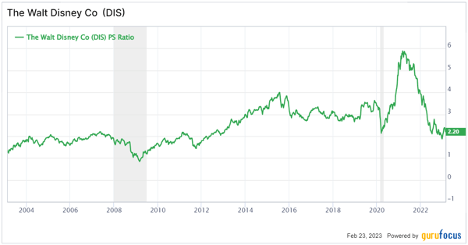
Disney trades at a price/sales ratio of 2.2. What does that mean? Is that good or bad?
To get an idea, let’s look at the ratio over the past 20 years.
Before the 2008 meltdown, a P/S of 2 was “about right” for Disney. For most of the 2010s, Disney traded at an average P/S of about 3. The ratio spiked in 2022 and 2021, due in part to sales dipping (a smaller denominator makes the ratio larger) and in part due to enthusiasm over the Disney Plus streaming app.
Well, after a brutal 2022, Disney is trading back at a “normal” valuation in line with its history. That suggests that, by this metric, Disney is a reasonably cheap stock.
Do I immediately run out and buy every stock that trades at a P/S ratio in line with its historical average? No, obviously not. But this is a nice starting point for further analysis.
But there exists one unique tool that can give you a strong valuation picture with the click of a button: Adam’s Stock Power Ratings system.
Value is one of the six primary factors that make up Adam’s system. But the value factor itself is a composite of multiple value metrics. That’s because, due to the quirks of accounting, some companies can appear perpetually cheap or perpetually expensive by certain metrics.
To throw out an example, real estate investment trusts (REITS) almost always look expensive based on the price/earnings ratio because their earnings are depressed by non-cash expenses like depreciation. So any screen that relies on the P/E ratio alone is going to miss potential bargains in REITs.
Adam’s system accounts for things like this, which is why it’s so valuable to not just value investors, but ALL types of investors.
Like Adam said above, take 5 minutes and look up your top holding for free at MoneyandMarkets.com. If you like what you see in your favorite stock — or even if you don’t — write us at BanyanEdge@BanyanHill.com with what you find.
And if you REALLY like using Adam’s Stock Power Ratings system and want to access a portfolio of top-rated stocks, do yourself a big favor and check out Green Zone Fortunes today.
Regards, Charles SizemoreChief Editor, The Banyan Edge