
Twenty years ago, the market was recovering from one of the worst declines in history.The dot-com crash wiped out nearly $5 trillion in market wealth from 2000 to 2002. And at an annual conference in Wyoming, Alan Greenspan had the unenviable job of defending the Fed. The former Chairman was famous for “Fed speak.” He knew traders would closely analyze his every word, so he made them deliberately unclear.Unlike Powell, who tells the markets exactly what to expect, Greenspan kept traders guessing. That way, he could change his mind or act between meetings.To me, this is common sense. We never broadcast our plans in the military. And his approach seemed to work — even during the internet boom and bust, inflation never reached 9%.Now, I was fresh out of high school when Greenspan gave his speech in 2002. But I’ve read it plenty of times since.And you should know that, as smart as he was, Greenspan was completely wrong about this…
You CAN Spot a Bubble Before It’s Too Late
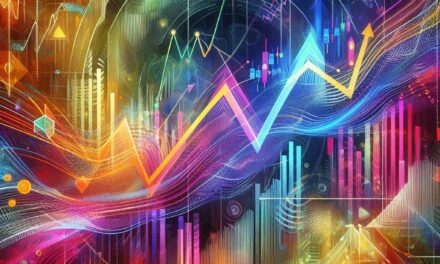
In his 2002 speech on the internet bubble, Greenspan said: “We recognized that despite our suspicions it was very difficult to definitively identify a bubble until after the fact — that is, when its bursting confirmed its existence.”For policymakers, this is true. They can’t risk popping a bubble too soon, because it might really be a new paradigm.In the 1990s, companies laid thousands of miles of fiber optic cables. This was funded by the internet bubble — and is now the backbone of high-speed connections we use every day.But we aren’t policymakers. We’re traders.And there are plenty of tools to spot bubbles in real time, if you have the discipline to follow them.Mike Carr gave you a simple example yesterday. With a 10-month moving average, you would’ve known when to sell in the 1720 South Sea bubble.Today, I want to look at the internet bubble — the one that, according to Greenspan, could only be identified in hindsight.The chart below shows the Invesco QQQ Trust (QQQ). This ETF tracks the Nasdaq 100, a tech-heavy index that was the center of the bubble:

(Click here to view larger image.)
Bollinger bands are a popular tool to identify if an asset is oversold or overbought. These bands are usually drawn two standard deviations above and below the 20-day moving average (MA).But many traders don’t realize that, with a few changes, they can also be used to spot bubbles…In this chart, the blue line is an upper Bollinger band. Here, I’m using a 200-day MA and 1.5 standard deviations. This combination tells us when the long-term trend has pushed prices to extremes. The red line is the lower band. I’m using a 20-day MA and 1 standard deviation, which tells us when the short-term trend has pushed prices to extremes.Combined, these Bollinger bands can show us how to trade bubbles in real time. When the red line crosses above the blue line, that’s the start of a bubble. When it falls below the blue line, that’s our sell signal.
This indicator spotted the internet bubble as early as November of 1999. And in April of 2000, it told you to sell just 10.6% below the top…Saving you from another 81% drop in QQQ over the next two and a half years.Now, I know Greenspan is smart. He managed the Fed better than anyone else. But he was wrong about bubbles then…And he’s wrong about them now.See, we’re currently experiencing a tech bubble of our own. Speculation pushed tech stocks to extreme prices over the last few years — only to have many of them fall over 50% in 2022.Plenty of investors have lost all their gains and then some.But Mike and I are here to show you that bubbles are nothing to be afraid of. With the right tools, you can time the top and preserve your wealth. Tomorrow, I’ll be sharing the single most important rule when it comes to trading bubbles. Ignoring this has caused would-be successful traders to lose it all…If you don’t want to be one of them, be sure to check your inbox tomorrow morning.
Until then, Amber HestlaSenior Analyst, True Options Masters