


I can get pretty geeked out by stock market figures and stats. Like yesterday’s action, for example.
The S&P 500 Index was down 4% at one point. Yet it managed to rally and ended the day in positive territory. It was a rally for the record books, for sure. That’s only the third time in the last 45 years that markets have recovered so fast from such a steep decline in the same day!
But yesterday’s epic display of percentage losses and gains in the S&P 500 aren’t the only ones I find interesting. Here are some others:
+11.6%…
+10.8%…
+9.4%…
+9.3%…
But these aren’t examples of annual returns for the index. They’re single day gains!
In fact, those are 4 of the 10 largest one-day percent gains since 1923. And they all occurred during the S&P 500’s last two bear markets in 2020 and 2008.
I’m not making this comparison to imply that we’re entering a bear market. Rather, I’m making the point that, despite volatile conditions, stocks don’t necessarily have to go straight down.
And just like yesterday’s incredible about-face, it illustrates an important lesson when it comes to navigating 2022’s new stock market reality.
Use Volatility to Your Advantage
The Ukraine/Russia standoff, Federal Reserve tightening, hot and cold earnings … all have investors freaked out lately. But there’s more to this volatility than bad news…
We’re entering a new phase of the stock market … where big, unexpected swings in either direction will rule the day.
That’s why a tactical, opportunistic approach to trading will be important for profits.
The only way you’ll be able to survive and thrive is to use volatility to your advantage.
You see, all those ups and downs in the stock market are hiding signals … especially signals to tip off powerful rallies that are about to unfold.
Now, I know that sounds counterintuitive, but simple measures of volatility are a great way to detect panic selling and extremely bearish sentiment.
One factor I follow closely to spot the next rally phase in stocks is capitulation. And right now it’s screaming…
How to Spot Capitulation
I’ve shown you before how the CBOE Volatility Index, or VIX, can impact the stock market for better or worse. It’s simply a measure of anticipated swings in the S&P 500 Index. Since the stock market tends to fall quicker than it rises, the VIX usually rises when stocks are plunging.
But there’s also a little-known indicator that measures how quickly the VIX is rising or falling. It’s called the VVIX and it does a terrific job at showing you when sentiment is hitting extreme pessimism.
It’s a great way to spot bottoms following a volatile period, which is exactly when those explosive rallies can occur. If you know the moment of capitulation, you can grab a seat on the rocket back up.
Take a look at the chart below of this gauge overlaid with the S&P 500.
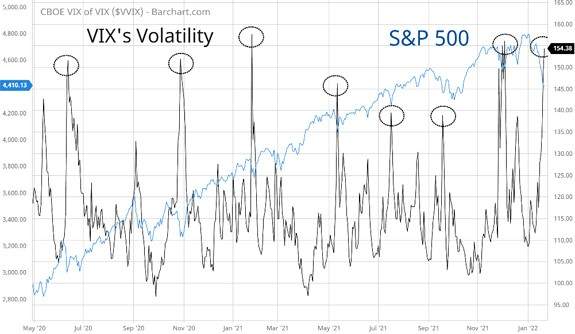
(Click here to view larger image.)
You can see how the large spikes occur near the end of sell-offs in the S&P 500. That’s because those spikes can signal panic-selling and capitulation … exactly the signs we saw yesterday.
The market got way too oversold, too fast … and once that point of capitulation hit … we saw a breathtaking recovery.
So, buckle up and get ready for a wild ride in 2022. We’re going to see a lot more of these sickening plunges and exhilarating comebacks. Be prepared to take advantage of the stock market’s incredible trading opportunities in either direction. One of the best ways to do this is with a trading service like my Flashpoint Fortunes. Click this link to hear why and how.
Best regards,

Clint Lee
Research Analyst, The Bauman Letter


