
Last week, I wrote about the relative strength index (RSI).
Truthfully, many people wrote about RSI last week. My article was different.
Most articles about technical indicators claim the indicators work well.
They include a couple well-selected examples. Many articles give the impression that trading is easy.
I didn’t do that. I highlighted some problems with the indicator and offered a fix.
This week, I do the same with another popular indicator.
Spotting the Problem With Stochastics
This indicator tweak is based on the same nine-word philosophy I shared last week: “To know what everyone knows is to know nothing.”
Everyone who looks at stock charts is familiar with the stochastic indicator. Many have tried to trade the indicator, but give up in frustration.
The problem with stochastics is that it gives too many signals.
The stochastic indicator is an indicator with two lines. One line is called the fast line. The other is the slow line.
It’s defined so that the value of both lines is always between 0 and 100.
The indicator gives buy signals when the fast line crosses above the slow line. A sell signal occurs when the fast line falls below the slow line.
The chart below shows one of the problems with the traditional stochastic indicator.
Stochastics is in the middle of the chart. The black line is the fast line, and the red line is the slow line.
Stochastic RSI vs. Traditional Stochastic
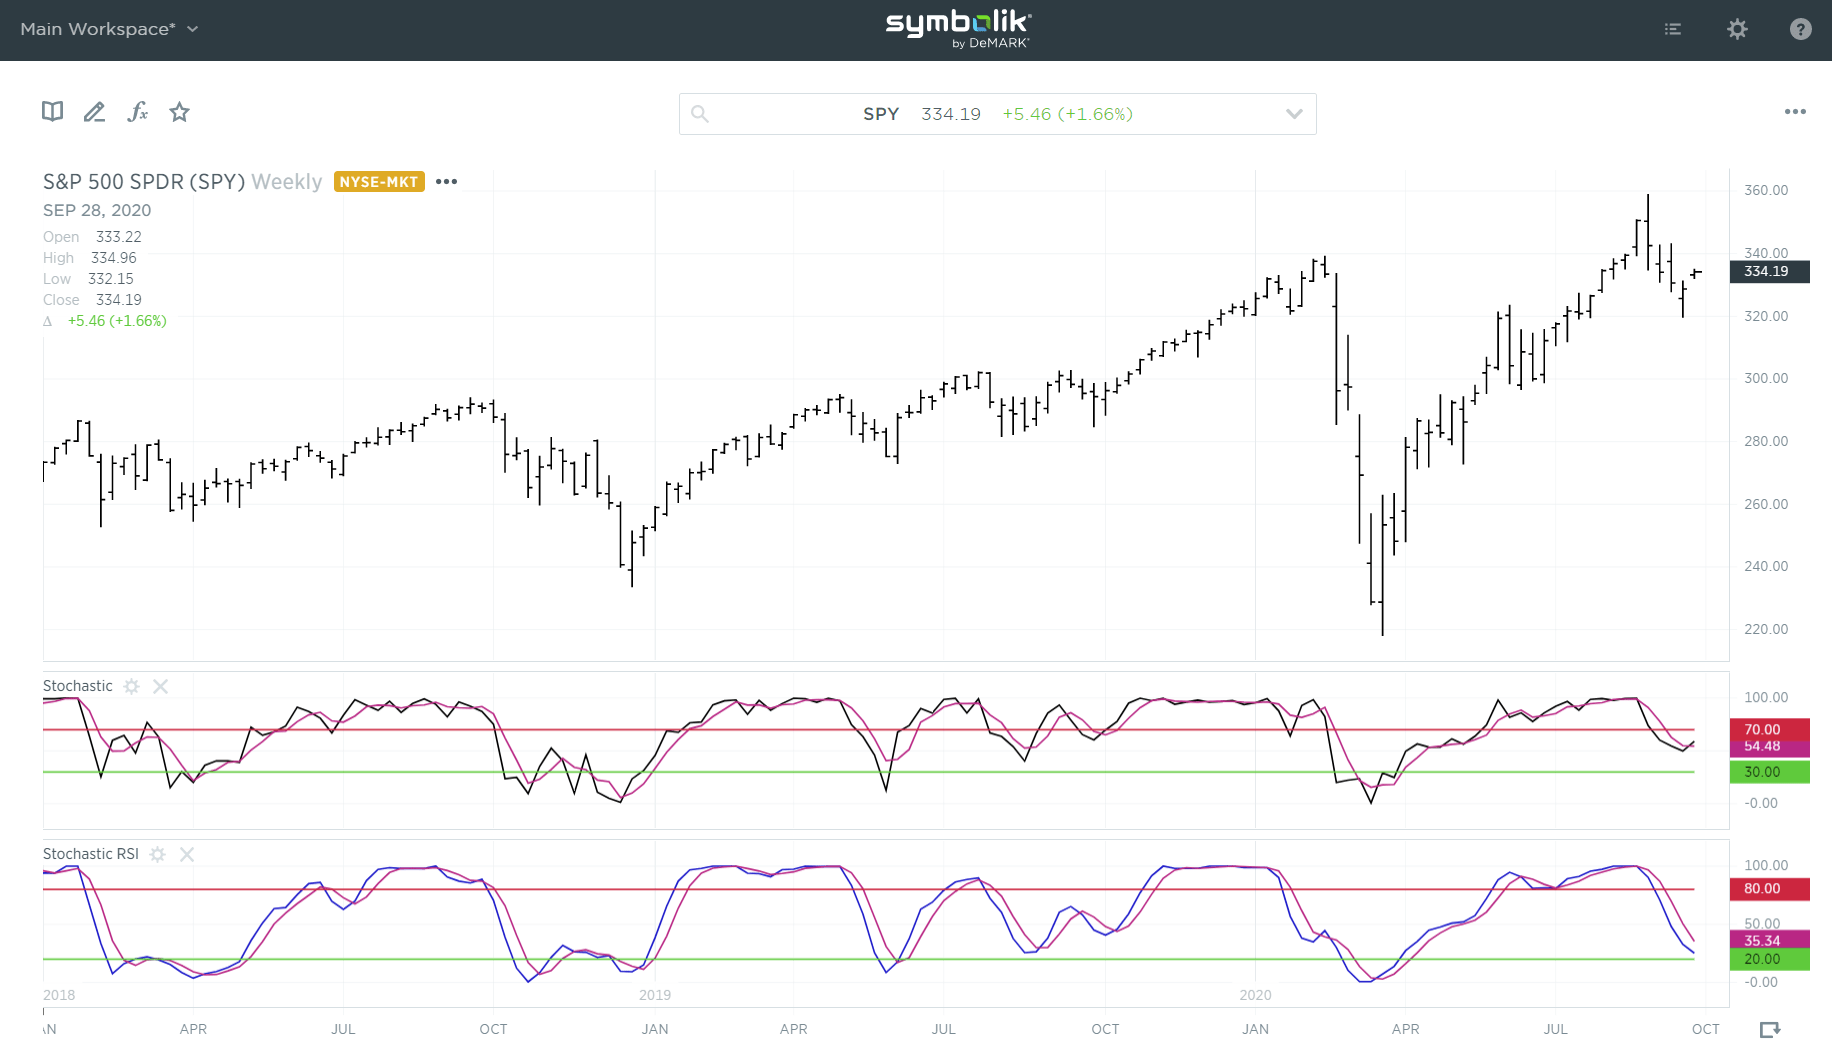
(Source: Symbolik)
In the chart shown above, stochastics just gave a buy signal.
However, the chart also shows that the indicator gives frequent signals. And many signals last just a few days.
Trade signals that are quickly reversed are called whipsaw trades. They are a problem because they lead to many small losing trades.
While large wins may offset the losses, traders can become frustrated with whipsaw trades. Some give up on the indicator before they enjoy the large winners.
Profit by Using This Stochastics Fix
At the bottom of the chart is an indicator known as the stochastic RSI. This indicator uses RSI instead of the closing prices in the calculation.
It’s smoother and has fewer whipsaws. Testing shows that it’s also more profitable than the traditional stochastic.
Stochastic RSI is now on a sell signal.
This is a more reliable indicator than stochastics. That tells us the stochastic buy signal is likely to be a whipsaw losing trade.
Traders could move to cash to decrease risk when they see a sell signal in stochastic RSI. Or they could use a strategy to benefit from the sell signal.
Put options allow traders to benefit from price declines. With this strategy, risks are limited and potential gains can be large.
The stochastic RSI, like the derivative oscillator I wrote about last week, and options aren’t something all investors know about.
That makes these tools potentially profitable for investors willing to do a little more work than the average investor.
Regards,
Editor, One Trade