All successful people know the easy way is rarely the “right” way … and the right way is rarely easy.
Think of a time when you tried taking a shortcut — in life, business or investing.
Did it turn out well? More than likely it didn’t.
Realize, I don’t fault you. We’ve all been there. Especially when we’re constantly bombarded with lures down the “easy” path in this new era of the internet and social media.
It’s a troubling change from how things used to be…
You probably grew up in the era when your best friend is the guy who told you the truth, not what he thought you wanted to hear.
When mentors and apprenticeships helped you transform from novice to expert on your chosen path to success. When doing the “right” thing filled you with pride and self-worth at the end of a long, hard day.
I know I did. My first friend was my dad, and he boldly told me at a young age that “life owes you nothing.”
Then, he showed me how to mow a lawn. One of countless ways to earn what I’m owed, and not just expect it.
The first $1,000 I ever made was $10 at a time … 100 weekly cuts for three neighbors, the summer I turned 13. It was the sweetest $1,000 I’ve ever made.
Because it took hard work … and there are no shortcuts in mowing lawns.
I mention all this because the “easy way” sure seems to be working well in 2023. The same old mega-cap technology stocks in the Nasdaq 100 — the ones that suffered the most in last year’s bear — are once again carrying the market higher. This time, because of nebulous dreams of ChatGPT becoming the heart of the global economy.
But would you believe that buying the Nasdaq 100 at the start of the year, full of these “shortcut” tech stocks, has actually held you back from far greater gains?
I can prove it.
And I’ll also share why I believe these stocks have the most to lose, not gain, as we enter the second half of the year.
You can buy nice … or you can lose twice.
It all comes back to a stock selection system I’ve been using for the past two decades now … and started sharing with others just a few years ago.
Tens of thousands of open-minded investors, business owners and savers use this system today to invest outside the mainstream. And they do well.
These are good-intentioned, hardworking people who are 100% committed to living a successful life. Even if they don’t have all the “answers” when it comes to navigating the economy and markets.
I call this system the Green Zone Power Ratings system. And it’s the single biggest contributor to market-beating gains I’ve ever seen.
Let me show it to you…
The True Driver of Lasting Returns
Contrary to what this year has suggested, news flow is not the true driver of lasting, market-beating stock returns.
At the end of the day, fundamental and technical factors drive returns. They always have. That’s why they’re the sole informant of my system.
The six factors I included in my Green Zone Power Ratings system are…
- Momentum: Stocks trending higher, faster than their peers, tend to outperform stocks that are moving higher at a slower rate (or trending down).
- Size: Smaller stocks tend to outperform larger stocks.
- Volatility: Low-volatility stocks tend to outperform high-volatility stocks.
- Value: Stocks that trade at low valuations tend to outperform stocks that trade for high valuations.
- Quality: Companies that exhibit certain “quality” characteristics — such as healthy balance sheets and persistently strong profit margins — tend to outperform the stocks of lesser-quality companies.
- Growth: Companies that are growing revenues, earnings and cash flow at higher rates tend to outperform the stocks of slower growing companies.
All told, my Stock Power Rating system considers 75 individual metrics, each of which falls into one of these six “factors.” Academic research and practioner results have proven over decades that these are persistent drivers of market-beating stock returns.
This rating system gives me, my team and our community of investors an immensely powerful tool…
If we’re curious whether a stock is “cheap” or “expensive,” we can quickly check my system and see the stock’s value rating.
If you want to judge how fast a company is growing, you can easily check its growth rating.
Here’s what that looks like, with highly rated stock Toll Brothers, Inc (NYSE: TOL)…
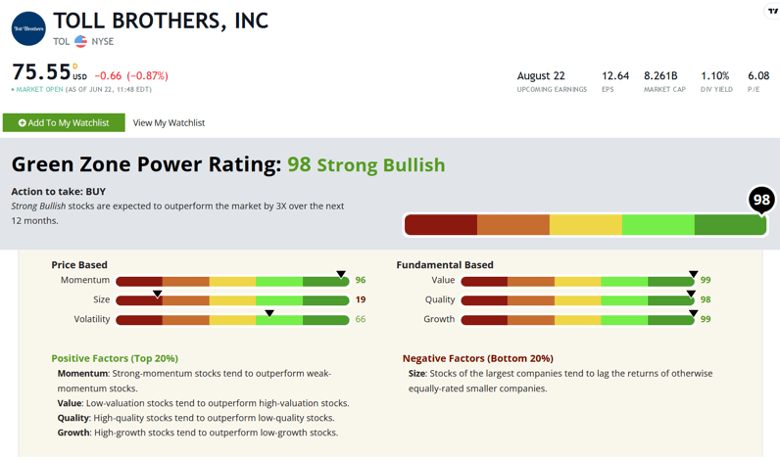
The Green Zone Power Rating system gives ratings between 0-100, for each of the six return-driving factors, as well as an overall rating.
As you can see above, TOL rates very high with an overall rating of 98 out of 100.
It’s lowest factor rating is on size. It earns a 19 out of 100, because TOL is on the bigger side with a more than $8 billion market cap.
But otherwise, TOL rates well on the other five return-driving factors…
- 96 on Momentum.
- 66 on Volatility.
- 99 on Value.
- 98 on Quality.
- 99 on Growth.
But, you might be asking…
How is it that TOL can be a “momentum” stock…
And a “value” stock…
And a “growth” stock.?!
This is one of the biggest misconceptions about investing … the idea that a stock can only be classified as one thing — either a “value” stock or a “growth” stock … a “momentum” stock or a “low-volatility” stock. Nothing could be further from the truth.
There are stocks out there that only rate highly on one of the six return-driving factors my system considers.
For instance, a stock that trades at a low price-to-earnings ratio and thus is a good “value” stock … but otherwise is large, volatile, not growing revenues and is trending downward.
A stock like that may earn a high value rating on my system, but would be rated quite low overall.
Those are not the stocks my team and I look for!
Instead, we leverage my system to find “well-rounded” stocks that rate well on four, five or all six factors, and thus earn a high overall rating. Specifically, any stock that rates 80 or above overall earns our “Strong Bullish” label.
My research shows that stocks rating 80 or higher on my system have historically gone on to beat the overall market’s return by 3X!
And as it turns out, TOL has returned nearly 50% year to date … considerably higher than the Nasdaq 100 tech basket.
In other words, when you can find a company and stock that’s beating the market on each of the return-driving factors … that’s the stock you want to get into!
However, that’s far from the only thing my system exposes…
Terrible Stocks You Might Own
My system, as you probably guessed, doesn’t just rate great stocks. It rates poor ones, too.
For example, here’s one you probably wouldn’t expect. It’s one of the bigger holdings in the Nasdaq 100 and the S&P 500, which carries the retirements of many Americans… Intel (Nasdaq: INTC)…
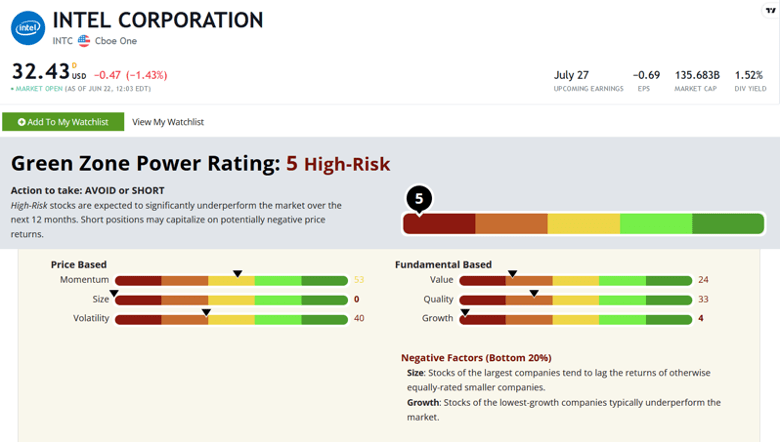
Intel rates a High-Risk 5 on the Green Zone Power Ratings system, with poor marks across the board. In fact, the only nice thing we can say about Intel is its middling momentum rating, as it’s ridden the coattails of the broader tech rally so far in 2023.
You have to understand… When you own an index fund like the S&P 500 or Nasdaq, you don’t just own the winning stocks. You own dogs like this, too.
And this is just one of nearly 2,000 stocks with a rating that indicates they should be nowhere near your retirement…
I recently published a piece of research on these 1,918 stocks, which updates weekly to immediately identify the worst stocks the market has to offer.
My hope is that you’ll make this report part of your weekly routine, and strongly consider selling any stocks you own that enter its ranks.
Then, once you’ve done that, I encourage you to check out another research report I published, which contains 11 of the highest rated stocks in the market — across all sectors, too, not just tech.
All these resources are available to members of Green Zone Fortunes, an elite investment newsletter that issues regular research reports on highly-rated stocks and why they meet our special criteria.
To join up for as less than $4 a month, have a look at all the information right here.
To good profits,
 Adam O’Dell
Chief Investment Strategist, Money & Markets

What’s Up With the Housing Market?

The National Association of Realtors just released their report for May, and it was full of juicy data on the state of the housing market.
Housing plays a huge role in the economy for a host of reasons.
Home purchases generally require a rush of additional spending on things like furniture and appliances, and the sector is a major creator of jobs.
Building a single-family house can require as many as 30 subcontractors, and this doesn’t include ancillary jobs like appraisers, inspectors and even the realtors themselves.
But what does the data say?
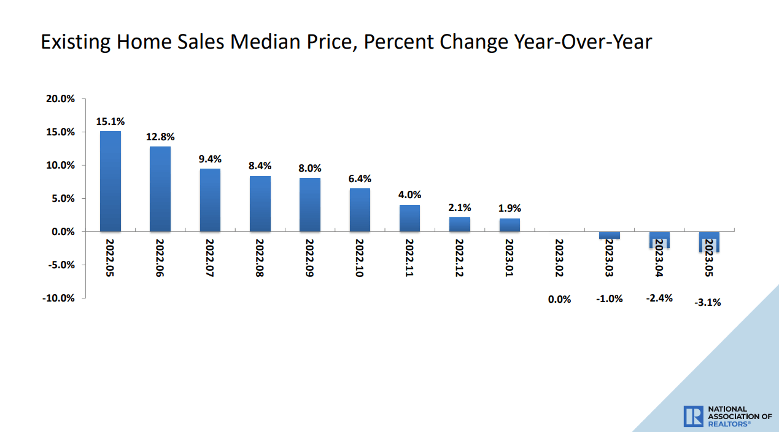
Home prices continue to slide lower. They were down 3.1% year over year in May. Of course, we’re bumping against some pretty nasty comparables.
Last May, prices surged by 15.1%. So what we are seeing in pricing is a normal cooling after an unsustainable run last year.
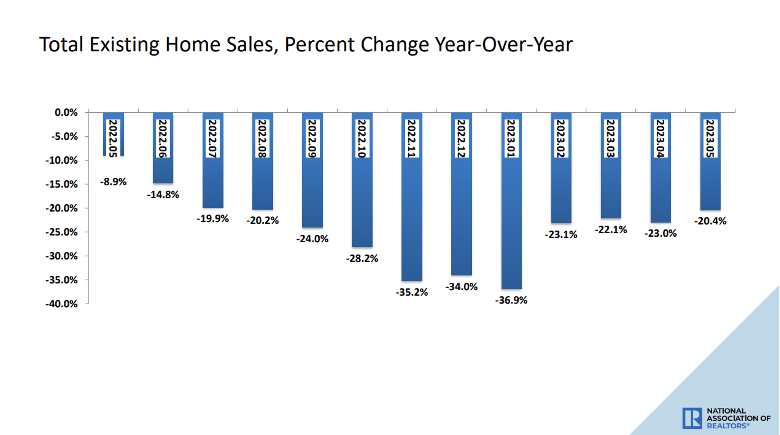
The data gets more interesting when you look at volume rather than price.
The number of homes sold in May was over 20% lower than the year before. And just a few months ago, the sales numbers were closer to 40% lower.
But there’s really no mystery here. When mortgage rates surged last year, house payments suddenly became unaffordable for a lot of would-be buyers.
And would-be sellers weren’t exactly in a hurry to sell in an illiquid market with few buyers. So the inventory of homes available to sell has dried up.
In May, there were 1.08 million homes for sale. Before the pandemic, the norm for this time of year was around 1.9 million homes, or nearly double.
The lack of inventory has prevented home prices from collapsing. But this is hardly the sort of foundation you’d want to see in place for a sustained rise in home prices.
At best, it’s a recipe for flattish home prices over the next few years.
Regards, Charles SizemoreChief Editor, The Banyan Edge