Since bottoming in late 2016, gold prices have rose a solid 13%, and have been up as much as 20%.
Still, 2018 is the more promising year for the precious metal.
I have written before about how gold just entered a new bull market and I have been watching the price of gold closely. As I previously wrote:
When I looked at gold over a long-term chart, there were two distinct markets it experienced over the last 12 years: a bull market followed by a six-year bear market… It experienced a massive bull market that actually started in the early 2000s… This was followed by a six-year bear market that just ended.
However, the price of gold has failed to garner any meaningful rally.
So, what gives? Why haven’t gold prices rallied?
Well, it’s just a matter of time.
Here’s the chart that shows us gold entered a long-term bull market.
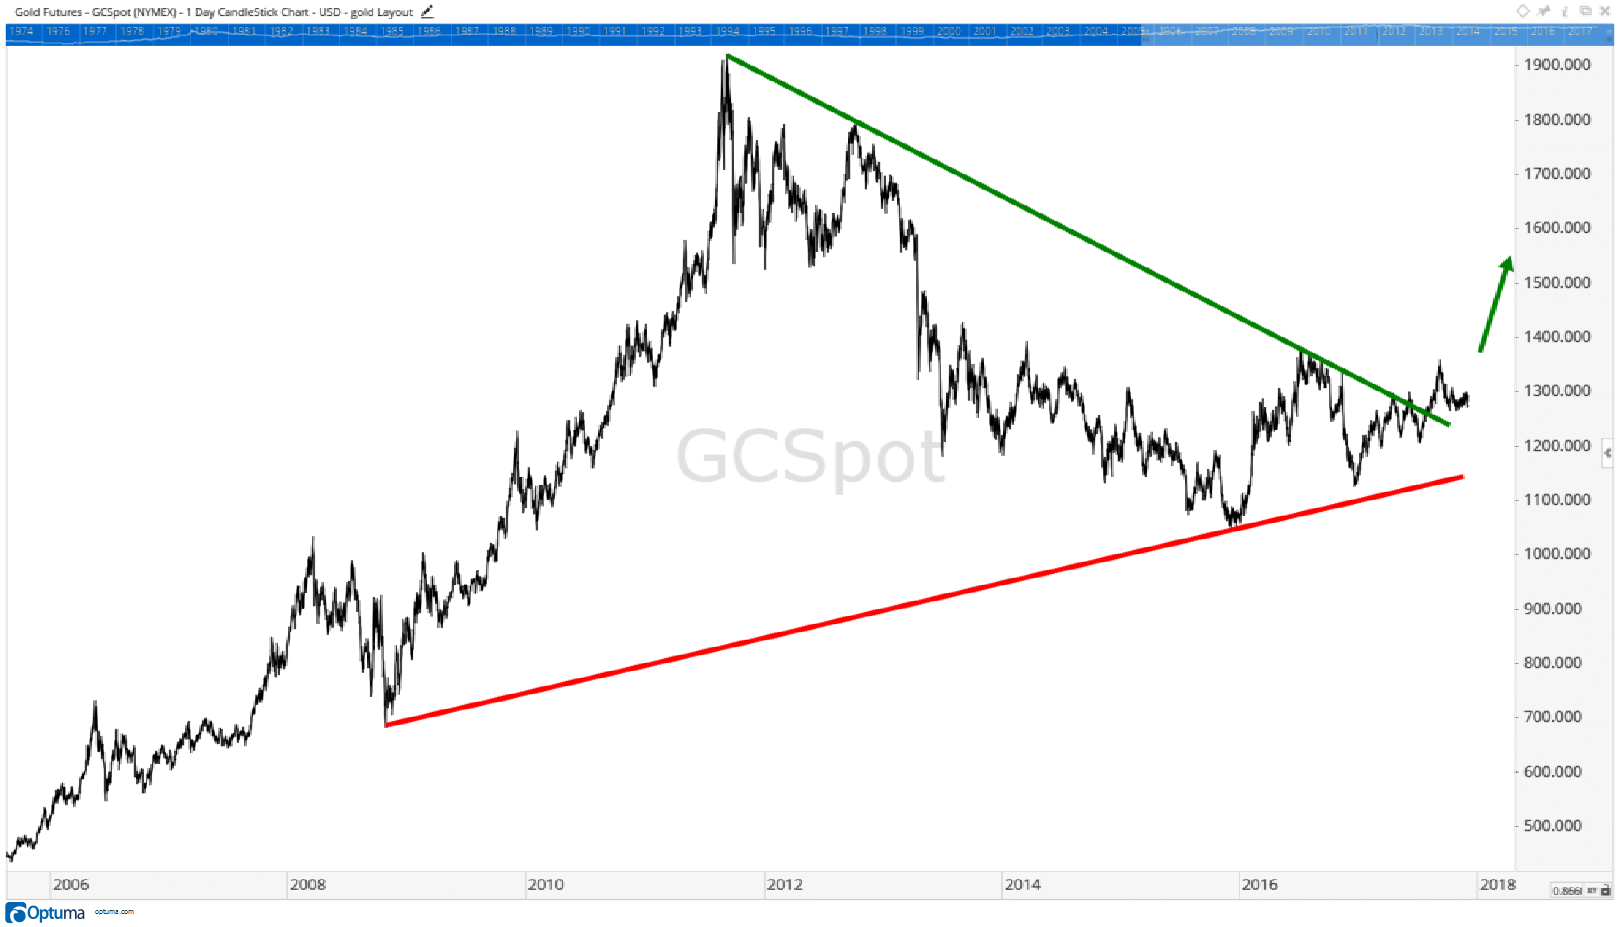
After gold prices broke above the green, downward-sloping trend line, it indicated prices entered a new trend, one that is heading higher.
And when you look at a shorter time frame for gold prices, you still get a bullish picture. Take a look:
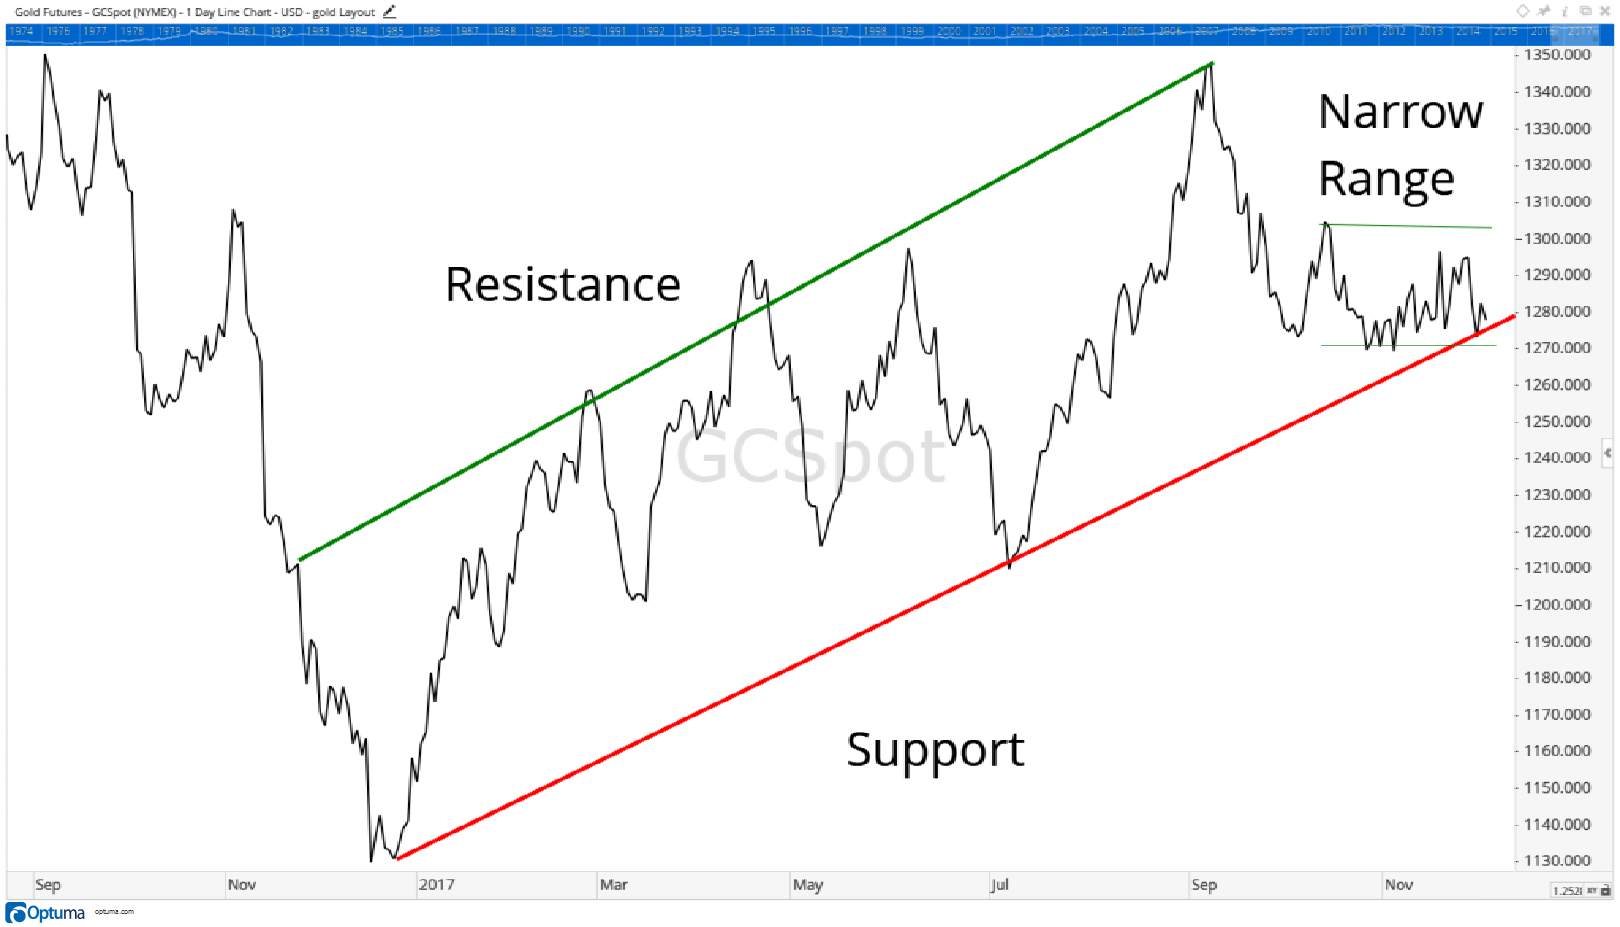
In this chart, you’ll notice prices have mostly stayed within the resistance and support lines, but recently have traded in a narrower range than usual.
This narrow trading range typically precedes an imminent breakout in price.
Usually, you don’t know which direction prices will break out, which is why there is the narrow range to begin with.
But considering the longer-term chart indicates prices are heading higher, that is where we can place our bets — and 2018 will be the year prices break out.
Regards,

Chad Shoop, CMT
Editor, Automatic Profits Alert