The recent stock market decline still haunts traders. Major market indexes are struggling to recover from the sell-off.
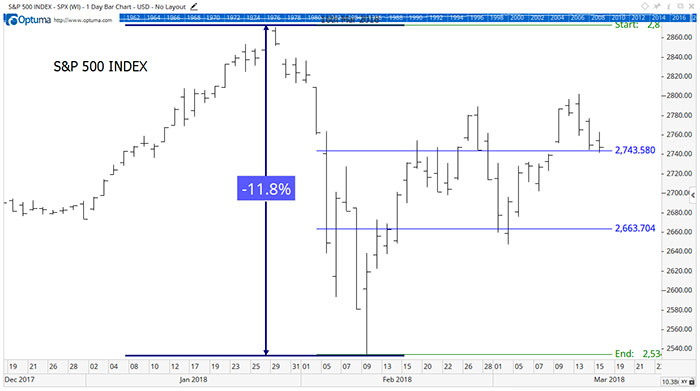
A chart of the S&P 500 Index shows the struggle. The chart below shows two very important price levels. Prices keep bouncing off these two levels.

Traders knew what these levels were the day the index bottomed.
After a sell-off, traders look for prices to rally, retracing their losses. Many traders plot retracement lines to show important price levels. Popular lines use Fibonacci ratios.
The lines in the chart show where prices recovered 38.2% and 61.8% of their losses.
Fibonacci ratios are popular among traders. There’s nothing magical about the ratios even though to some traders, the numbers possess supernatural qualities.
The truth is, Fibonacci ratios are built into the most popular software platforms. So, because they’re there, traders use them. It’s that simple.
Hedge fund traders draw their ratios and buy or sell contracts when prices touch the ratios.
The lines enforce a discipline, and successful traders need a disciplined approach. Because the exact same lines are on so many charts, Fibonacci ratios become important.
Fibonacci ratios aren’t important enough to be the only tool a trader needs. But they’re useful when combined with other tools.
Traders who are bullish on stocks are using the 61.8% retracement to add to positions. If prices fall below that level and reach the lower line on the chart, they could become sellers.
We’ll know a new bull market begins when prices reach new highs. Likewise, a close below the February low will signal a strong down move is underway.
Following the price action on a chart will help us see what the next big trend will be. It also helps us understand why prices are so volatile now, because traders are awaiting the next trend before committing large amounts of new money to the market.
Regards,

Michael Carr, CMT
Editor, Peak Velocity Trader


