


That happened fast.
Just 15 trading days for the S&P 500 to hit correction territory (at least on an intraday basis) last week, making it one of the fastest in history to kick off a new year.
That’s a bit concerning on the heels of a mostly calm 2021, where the S&P 500 barely registered a 5% decline.
Does this sudden burst of volatility tell us something about the stock market? Are we now careening over the edge and staring into a bear market abyss?
Before you assume that 2022’s bad start is about to turn into something worse, lean on history to guide you.
Here’s what it says.
To Buy or Not to Buy
The table below from LPL Research shows all 32 times the S&P 500 fell at least 10% and into correction since 1980.
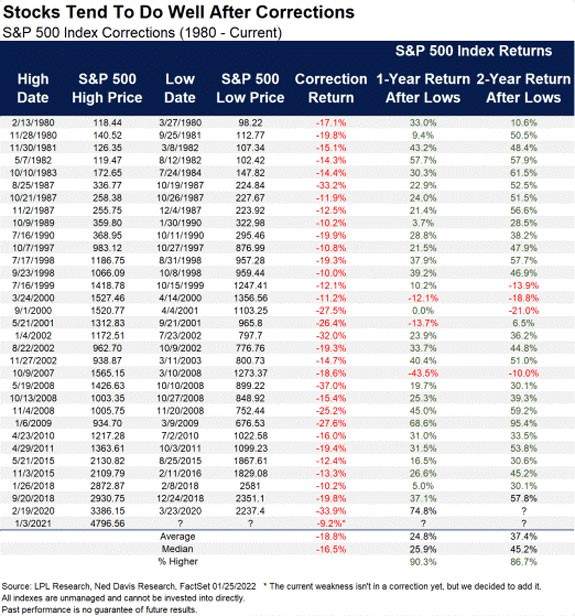
(Click here to view larger image.)
Two figures stand out:
- Buy the Dip! On average, the S&P 500 is up nearly 25% one year after the correction low (with hindsight knowing the low was in … of course).
- Not So Fast! There are a few glaring red numbers in that one-year return column that make me nervous.
And, those losses in the one-year return column all share a common feature.
Each one occurred near a recession.
That will make all the difference this time around as well.
Avoiding a recession will determine if this is a buy-the-dip moment or not.
That’s because stocks are still collectively expensive, despite the correction. Investors need earnings growth to power gains. Of course, a slowing economy that clobbers earnings growth is a recipe for disaster in this market. That’s why I’m following a critical metric to know if a recession is around the corner.
The Signal From Junk
By the time a shaky economy shows up in reports like gross domestic product, it will already be too late for investors. That’s because most measures of economic activity are backward-looking, not forward.
That’s why you should look to the bond market for an early warning that recession could be lurking around the corner.
I’m specifically watching the path of high-yield spreads. A spread is what junk bond investors demand in extra compensation for taking risks on companies with lower-quality balance sheets. When it’s rising, it can be a sign that economic conditions are expected to worsen.
The good news is, high-yield spreads have yet to match the jump in stock market volatility, as you can see in the chart below.
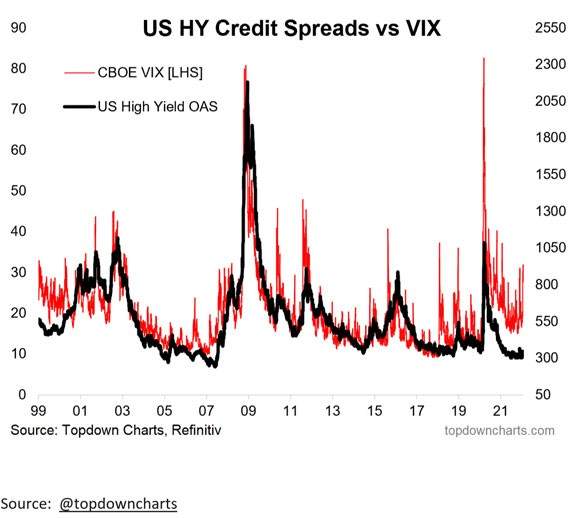
(Click here to view larger image.)
Notice other episodes where spreads shot higher along with stock volatility. That was especially the case during the first tech bubble and the Great Financial Crisis … when it didn’t pay to buy the dip.
That means the outlook for the economy and corporate profits remains intact for now, but conditions can change rapidly.
So don’t lose sight of the message from spreads!
I’ll certainly be watching that signal closely.
As Ted always says: Stay smart and tough. Watching these kinds of indicators is one way to stay smart and focus on the big picture.
Best regards,

Clint Lee
Research Analyst, The Bauman Letter


