

With Ted out of the country, Clint stepped into the hot seat alone for today’s Your Money Matters to give you the lowdown on areas of the market seeing steep falls from their highs.
Does that mean it’s time to go bottom fishing and grab those opportunities?
Before you get ahead of yourself, Clint says to take a step back and look at the big picture.
Because yes, many speculative areas of the market are tempting and have already seen a 50% peak-to-trough decline, but it’s not what it seems.
Clint guides you toward the sectors that have seen true carnage, trade at reasonable valuations and are seeing good expected earnings growth. He also gives you three solid stock picks to get you started.
Click here to watch this week’s video or click on the image below:
Transcript
Hey everyone, Clint Lee here for The Bauman Letter, with the next edition of Your Money Matters.
Yes, I am going it alone today. Ted recently traveled back to South Africa and he is getting the homestead in order. He’s doing fine. He sent me a picture the other day of the view from his house and it is absolutely beautiful. The one thing that really stuck out to me in the picture is just how green everything is. I forgot that it is summertime down there. Meanwhile, here in Ohio, just outside my window, we’re right in the middle of an ice storm, but the ice storm is supposed to wind down here soon and transition to snow and dump about six to eight inches on us by the time we’re done with this on Friday morning. So, summertime is sounding awfully good right about now.
Today, before we jump in, just as a reminder, if you see the little “i,” the link above my left shoulder, it’s on the top right of your screen. You can click on that link and learn how to get started with The Bauman Letter. For our investment recommendations, a lot of times, it comes back to first looking at the big picture and where that can lead us to opportunities. And so that’s what I want to talk about today. I want to talk about sort of the big picture of where we stand in the market right now. I want to talk about some of the areas that have seen a pretty steep peak-to-trough decline already. And if those areas are offering up opportunities and if not, where might we find those opportunities? So, what I want to start with today is some of the more speculative areas of the stock market. All the talk of “We’re in a bubble, but we’ve already seen, once again, especially more speculative areas of the stock market, a pretty sizable peak to trough decline.
I mean, you can argue that growth stocks, more speculative growth stocks peaked out a year ago back in February, of 2021. And we’ve seen large declines in other, once again, the more speculative assets as well. So, here’s the chart really quick:
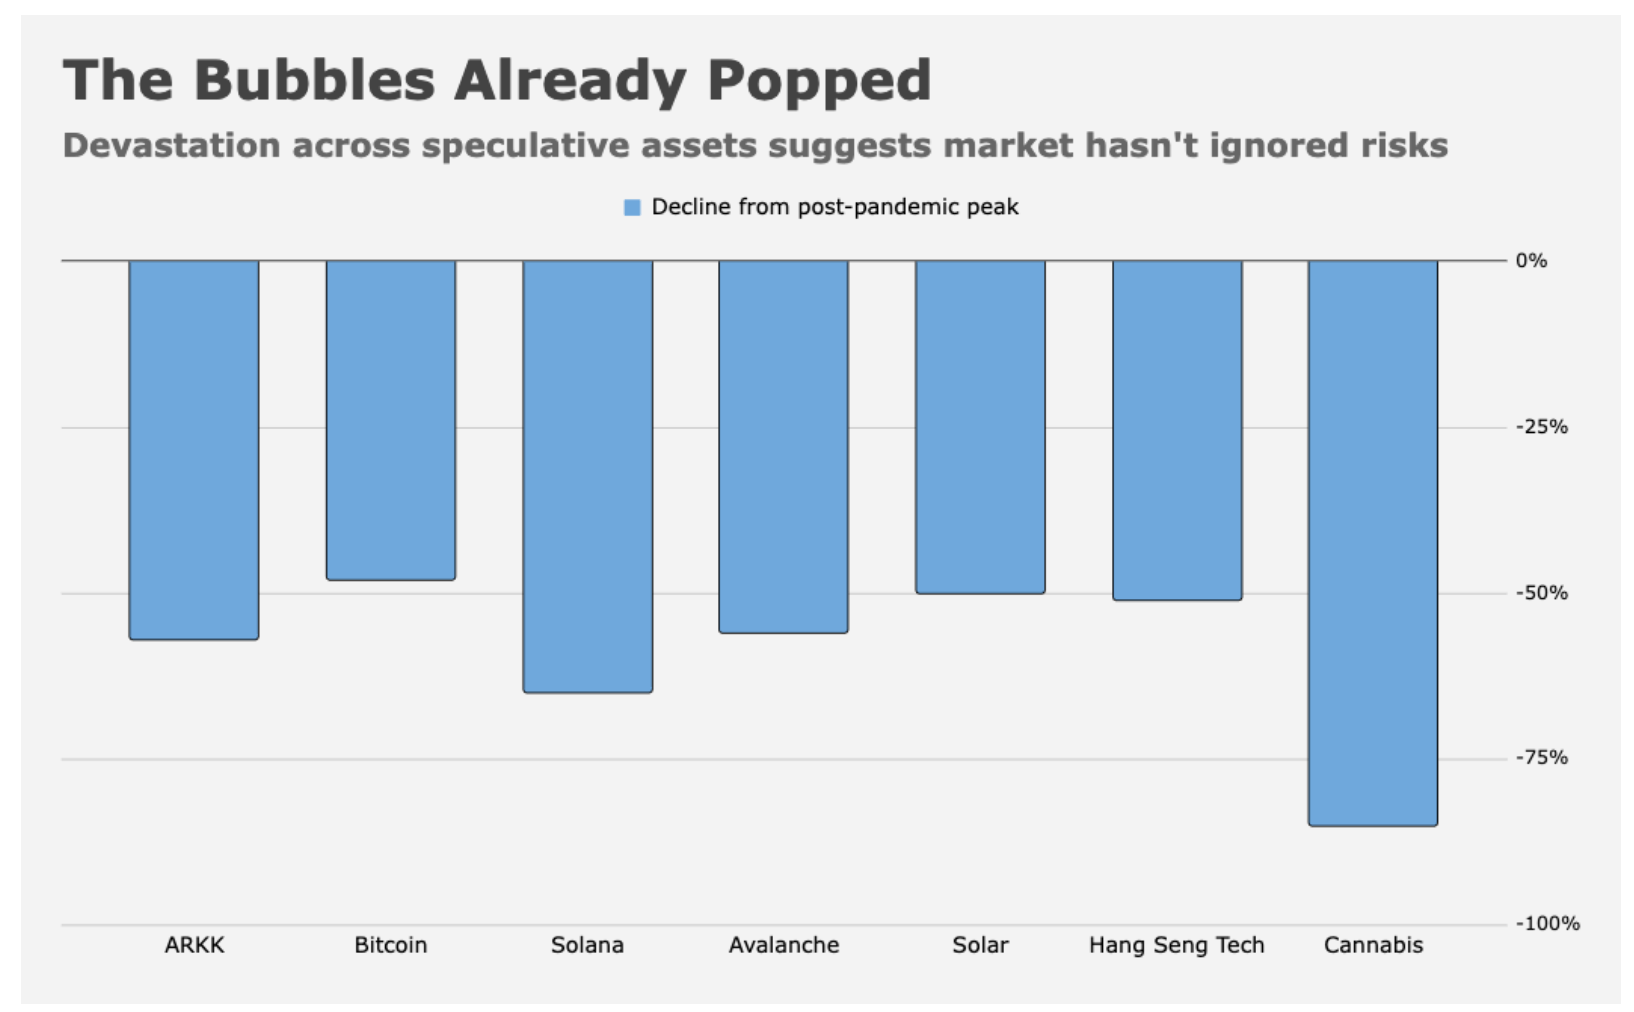
Source: Heisenberg Report
This comes from the Heisenberg Report, just highlighting the size, the magnitude of the decline that we’ve seen of 50% or more across some of these different asset categories. I mean, looking at areas like ARK, bitcoin and some other crypto on there, solar stocks, we’ve seen the renewable energy space pulling back sharply, Chinese tech stocks, the pot sector. So just highlighting these more speculative areas of the market have already seen a magnitude of 50% peak-to-trough declines already. And so, have we already seen a bursting of the bubble and are there opportunities to be had here?
And certainly if you were going to comb through some of these indexes, some of these ETFs, you’re going to be able to find opportunities, but collectively not. I want to focus more specifically on the growth stock space collectively. We still have some excesses out there. And so the next table I want to show comes from Verdad Advisers and they put together their own “Bubble 500” to kind of mimic (what we always talk about) the S&P 500. Well, they put together a Bubble 500 of real expensive stocks and hyped up growth sectors. And I want to show you just how valuation metrics look, even despite the pullback that we’ve seen. These large peak-to-trough declines that we’ve already seen in this space. Things are still collectively expensive. So, here’s that table:
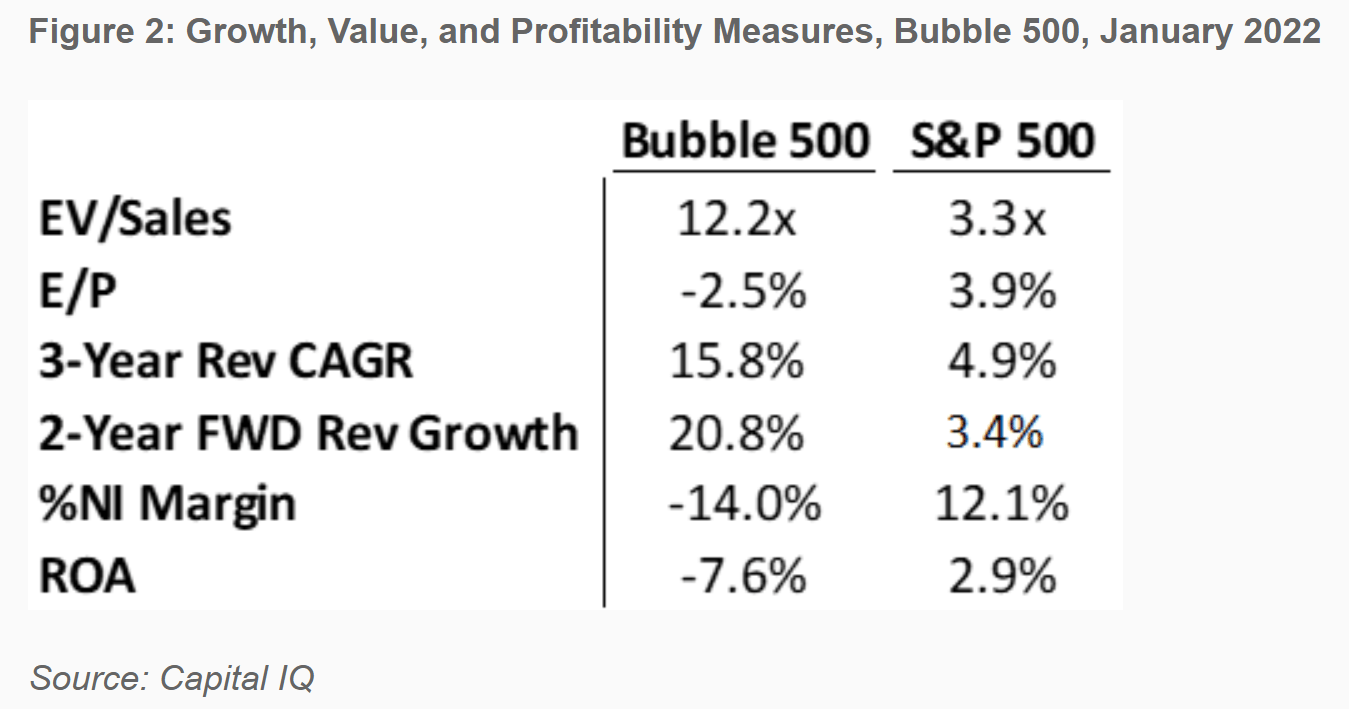
The one figure I’d point to first is enterprise value to sales. Enterprise value is a good measure because it takes in consideration a company’s market cap in addition to net debt on the balance sheet.
So, all sources of capital stripping out cash relative to sales. You see the Bubble 500 on here still trades at over 12 times compared to the S&P 500 at 3.3 times. These stocks, they work for a while because of a favorable macroeconomic backdrop, a good low rate environment. And because you could get a lot of growth here, you can still see the revenue projections, the three-year revenue compound growth rate. The two-year forward revenue growth, far outpacing the S&P 500. But what matters right now is valuations and profits. Valuations are expensive. You can see various measures of profitability, like the earnings yield, net interest margin and return on assets at the bottom, all in negative territory. So despite the large declines that we’ve seen in the space, that the growth space in particular is by many majors still way overvalued relative to the S&P 500. Now, let’s look at the broader market itself because we’ve seen a really rough start to 2022.
One of the worst starts on record. We saw the S&P 500 only in about 15 trading days reach correction territory, at least on an intraday basis. Last week, it reached correction territory. We’ve seen a nice little rally unfold off the lows that we hit last week. But I just want to show you with the decline that we did see, what this did to the price-to-sales ratio of just the broader market. So, let’s shift from talking about some of these more speculative areas of the market to just looking at the broader market in general. And so, here’s a price-to-sales ratio for the S&P 500:
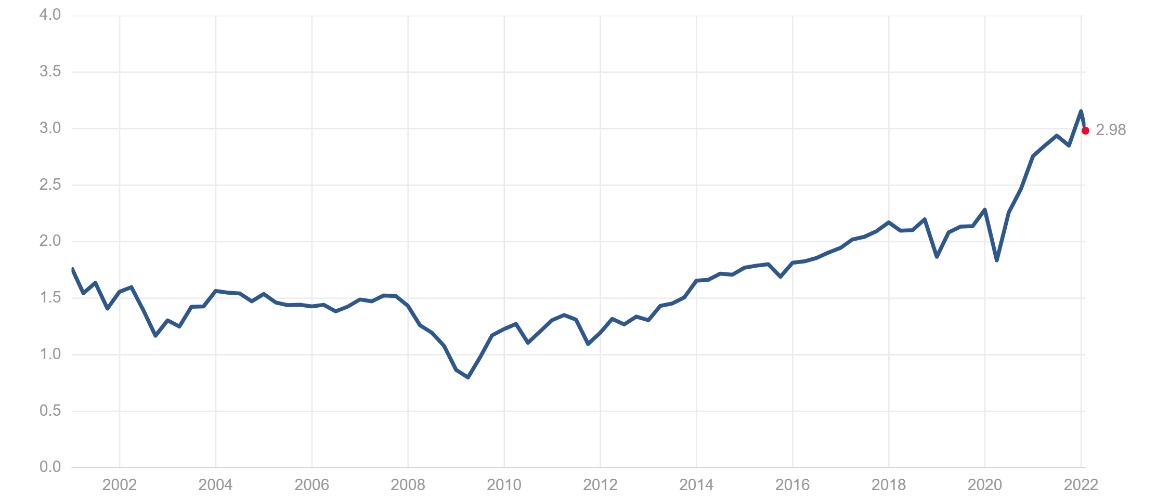
Source: Multpl.com
Going back, if you look at the very right-hand side, I mean, you can see just that little blip on the chart, that’s what the correction did to the price-to-sales ratio. So still extremely elevated to what we’ve seen in the past, at least going back 20 years or so on here.
And so what matters right now is that the valuations are justified with earnings growth. And that’s where another concern starts to set in, especially as we’ve progressed through a couple earnings seasons now as the supply chain disruptions, as the inflation picture and the challenges there have emerged. Look at what’s been happening with earnings estimates for the S&P 500. So, here’s a table that shows all the different S&P 500 sectors, but I want to focus just on the index itself:
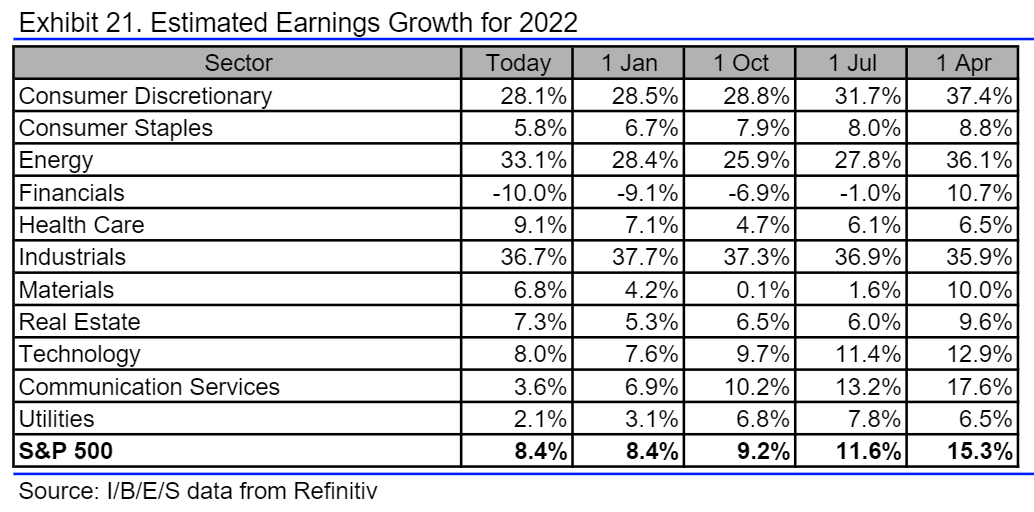
If you look at the very bottom of this table, you’ll see the S&P 500 overall. And this is how earnings growth projections for 2022 have evolved throughout different points in time, going back here. So if you look on the right-hand side, you’ll see in April last year, analysts were expecting about 15% earnings growth for 2022, July of last year that dropped to 11.6%, by October it was at 9.2%. And now since the start of the year and to today that number’s at 8.4%.
So since April last year, earnings growth estimates for 2022 have been nearly cut in half for the S&P 500, at the same time, you have valuations where they are. And so that is a big reason of why we’re seeing all this volatility right here in the market. So you might say, “Okay, we’re making the case, their gross stocks are still expensive. The market’s expensive, and now you’ve got earnings growth rates coming down, is there anywhere to go?” And the answer is, yes. And I think this is where, when you look at the big picture, you want to really look for the longer-term signs in sectors and areas of the market that have seen sort of, I’m going to call it, this panic selling capitulation. That’s finally starting to turn around from a sustained longer-term period of underperformance. That’s where you can still find some good opportunities in this market. And I’ll give you just a couple examples right here.
One, is with the energy sector. Now you might say, “Okay, the energy sector had a really good 2021. It’s had a nice start to 2022. How is this a good area, a good value opportunity?” Well, it’s when you look at energy’s longer-term performance relative to the S&P 500 and some of the earnings growth projections and valuations there. So, let’s start with that longer-term performance first. Here’s a chart:
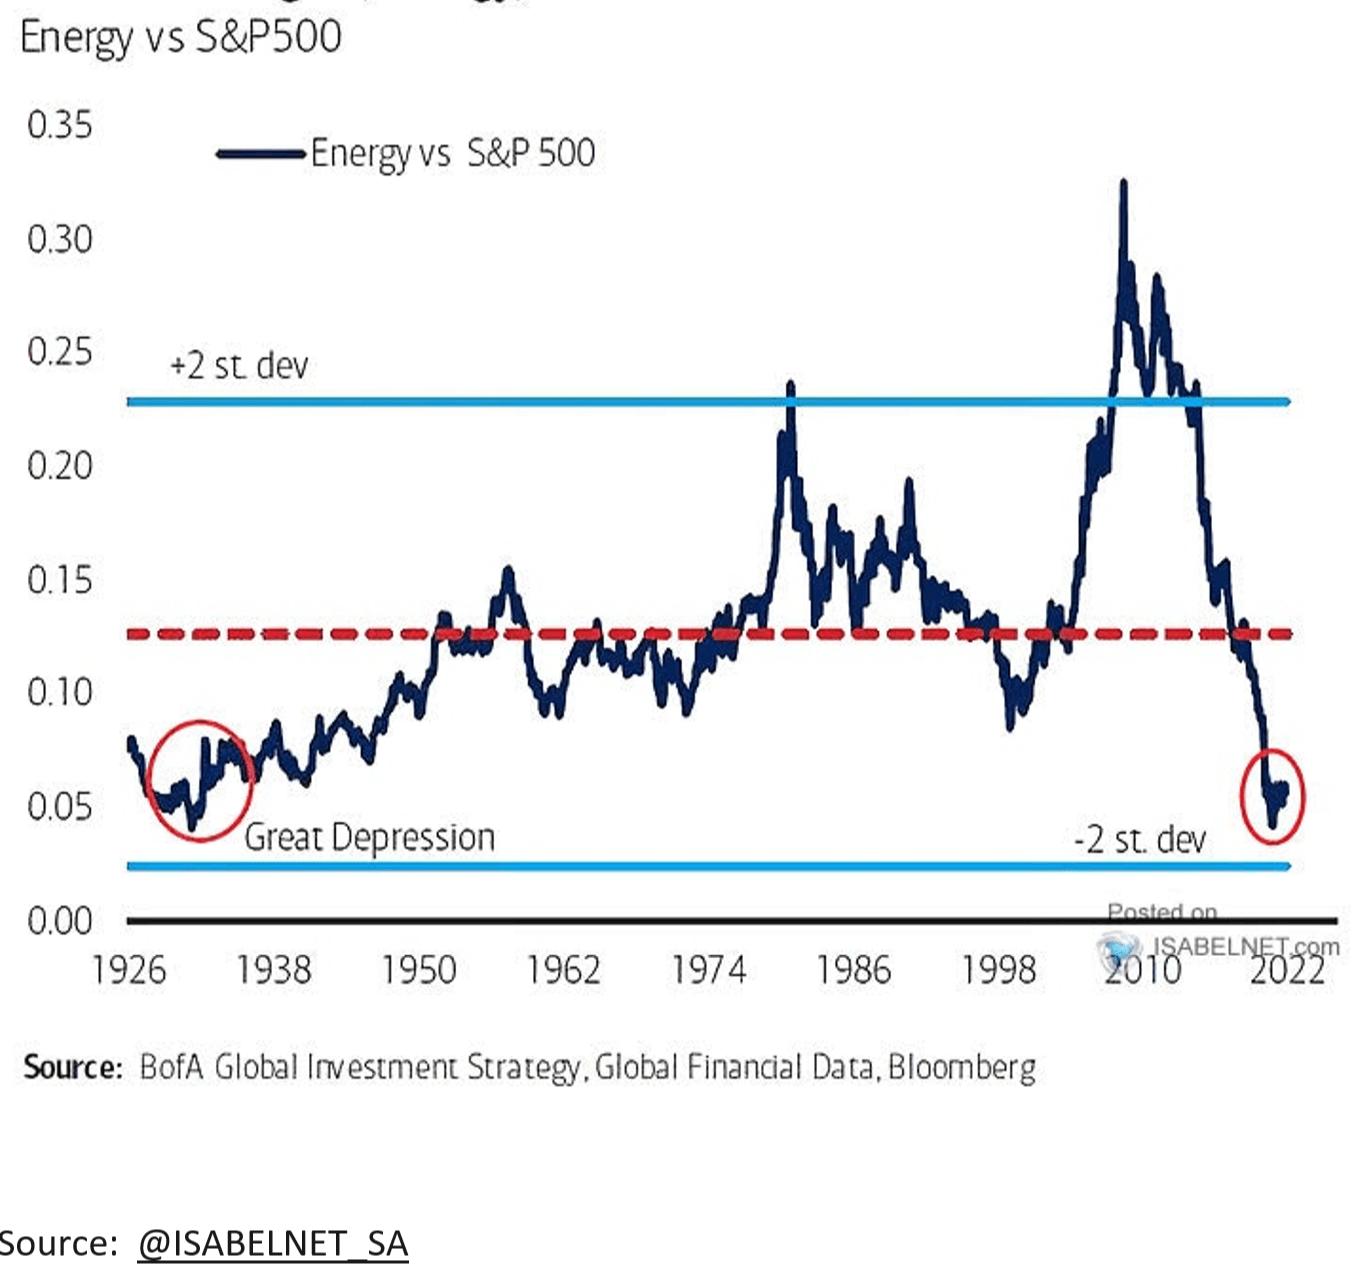
This comes from Bank of America. So, this is plotting out the price ratio. Think of it as a relative performance of the energy sector versus the S&P 500 ones. Rising energy’s doing better than the S&P, vice versa when it’s falling. Now, notice this plot goes all the way back to the 1920s. The red dash line in the middle is how this ratio looks on average. And then the lighter blue lines across the chart here are plotting out the two standard deviations level.
So when this ratio starts to hit extremes, either on the upside or the downside. And so if you look, just recently, we have fallen to almost a -2 standard deviation event. The lowest since the Great Depression, in terms of sustained energy sector underperformance against the S&P 500. And you can see that started right around the 2010 decade there, especially underperformance picking up pace, I think sometime after 2014. And so, even the recent turn in relative performance that we’ve seen has still left this ratio at very depressed levels. And I’m bringing this up because another thing to look for with the energy sector, although we’ve seen overall market growth rates for earnings this year getting cut, the energy sector’s expected to put up 42% earnings growth in 2022 versus 2021. And you might say, “Okay, well, that has to be off of what was still extremely depressed levels for earnings, so those are easy comps.”
Well, when you look at this … energy sector earnings, if they hit that growth rate for 2022, that’ll put earnings for the sector overall at the highest level since 2014. So, just something to know, back in 2014, I believe the sector was trading right around or just below a 14 P/E multiple, right now today that multiple was right around 12. So, strong range recovery with reasonable valuation after a sustained period of underperformance. That’s one area I’m highlighting, where you can still find opportunities here.
Energy Select Sector (NYSE: XLE) is the broader energy sector ETF. And S&P Oil & Gas (NYSE: XOP), if you want to get more specifically into oil and gas exploration names. One other area I’ll highlight and then we’ll be done here, is with the international markets. So similar to the energy sector, looking at longer-term sustained periods of outperformance or underperformance with international stocks compared to the U.S. So, here’s a chart:
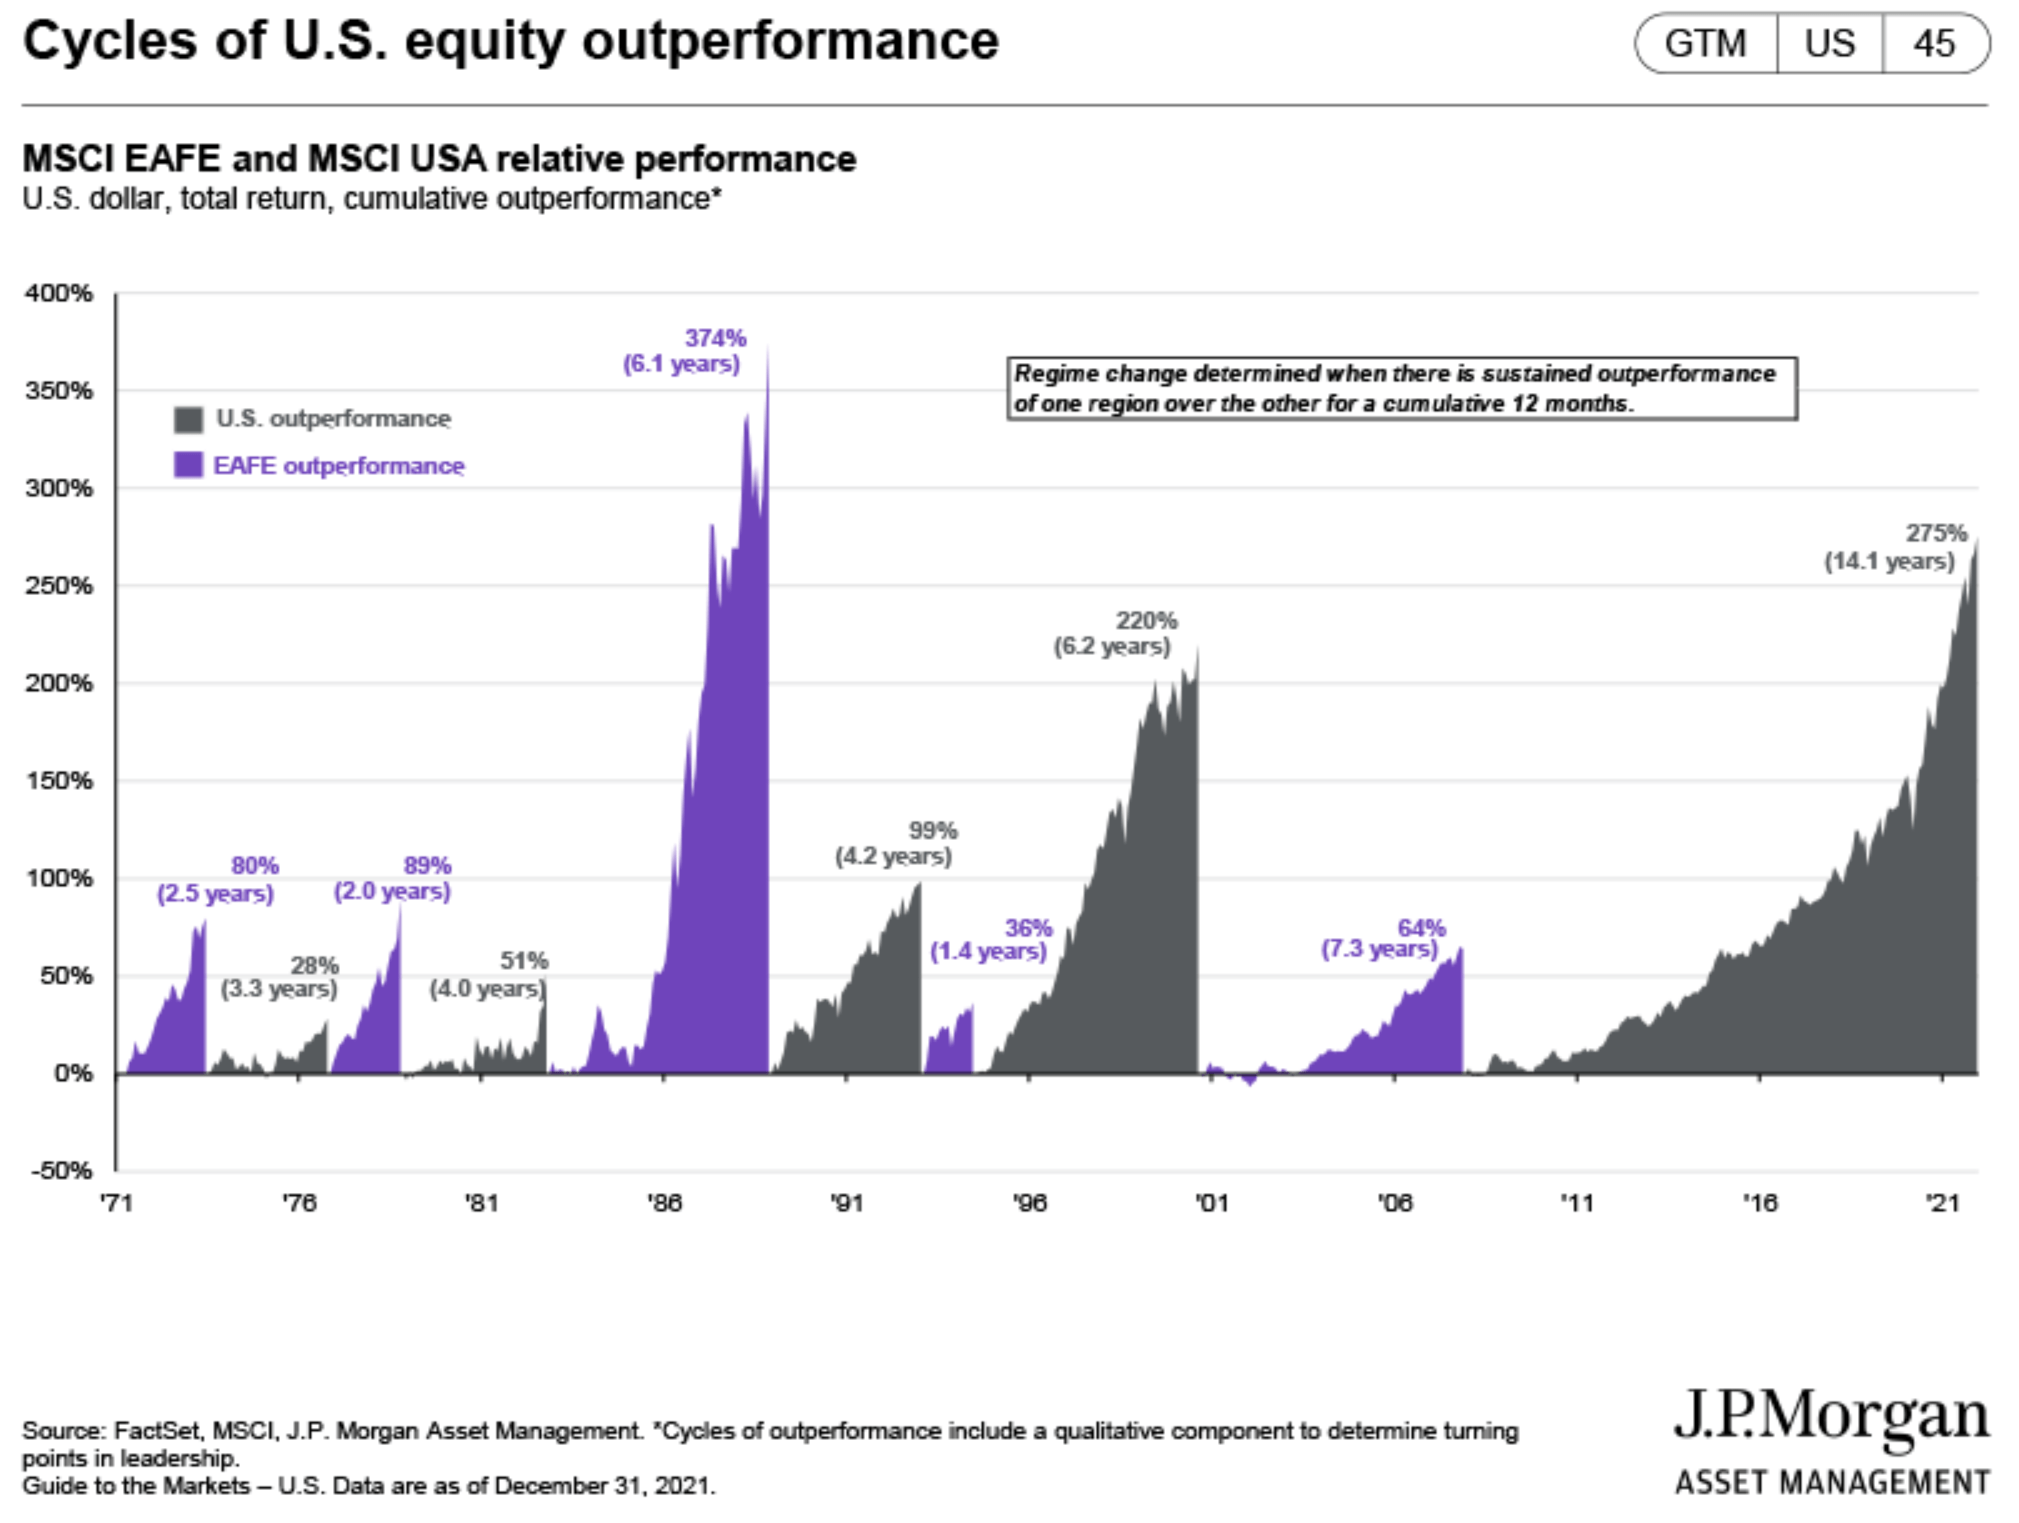
This comes from JPMorgan, and this is plotting out when you start to see cumulative sustained periods of outperformance of the U.S. versus international or when international takes the lead. So, the purple bars on here, you can see this goes all the way back to the 1970s. The purple bars on here is when international, once again, on a sustained basis, has taken the lead and what the cumulative sustained return looks like over that time. The darker gray lines on here is when the U.S. is leading. And so, if you look at the right-hand side, you can see we’re entering this 14-year period of the U.S. stock market is absolutely trouncing international stocks. Once again, 14 years. I mean, you can compare the magnitude of time and size outperformance on this chart relative to past periods on here. But this is, once again, creating some big valuation discrepancies, as well, in international stocks. So, here’s another chart here from JPMorgan showing the valuation discount of international stocks compared to U.S. stocks:
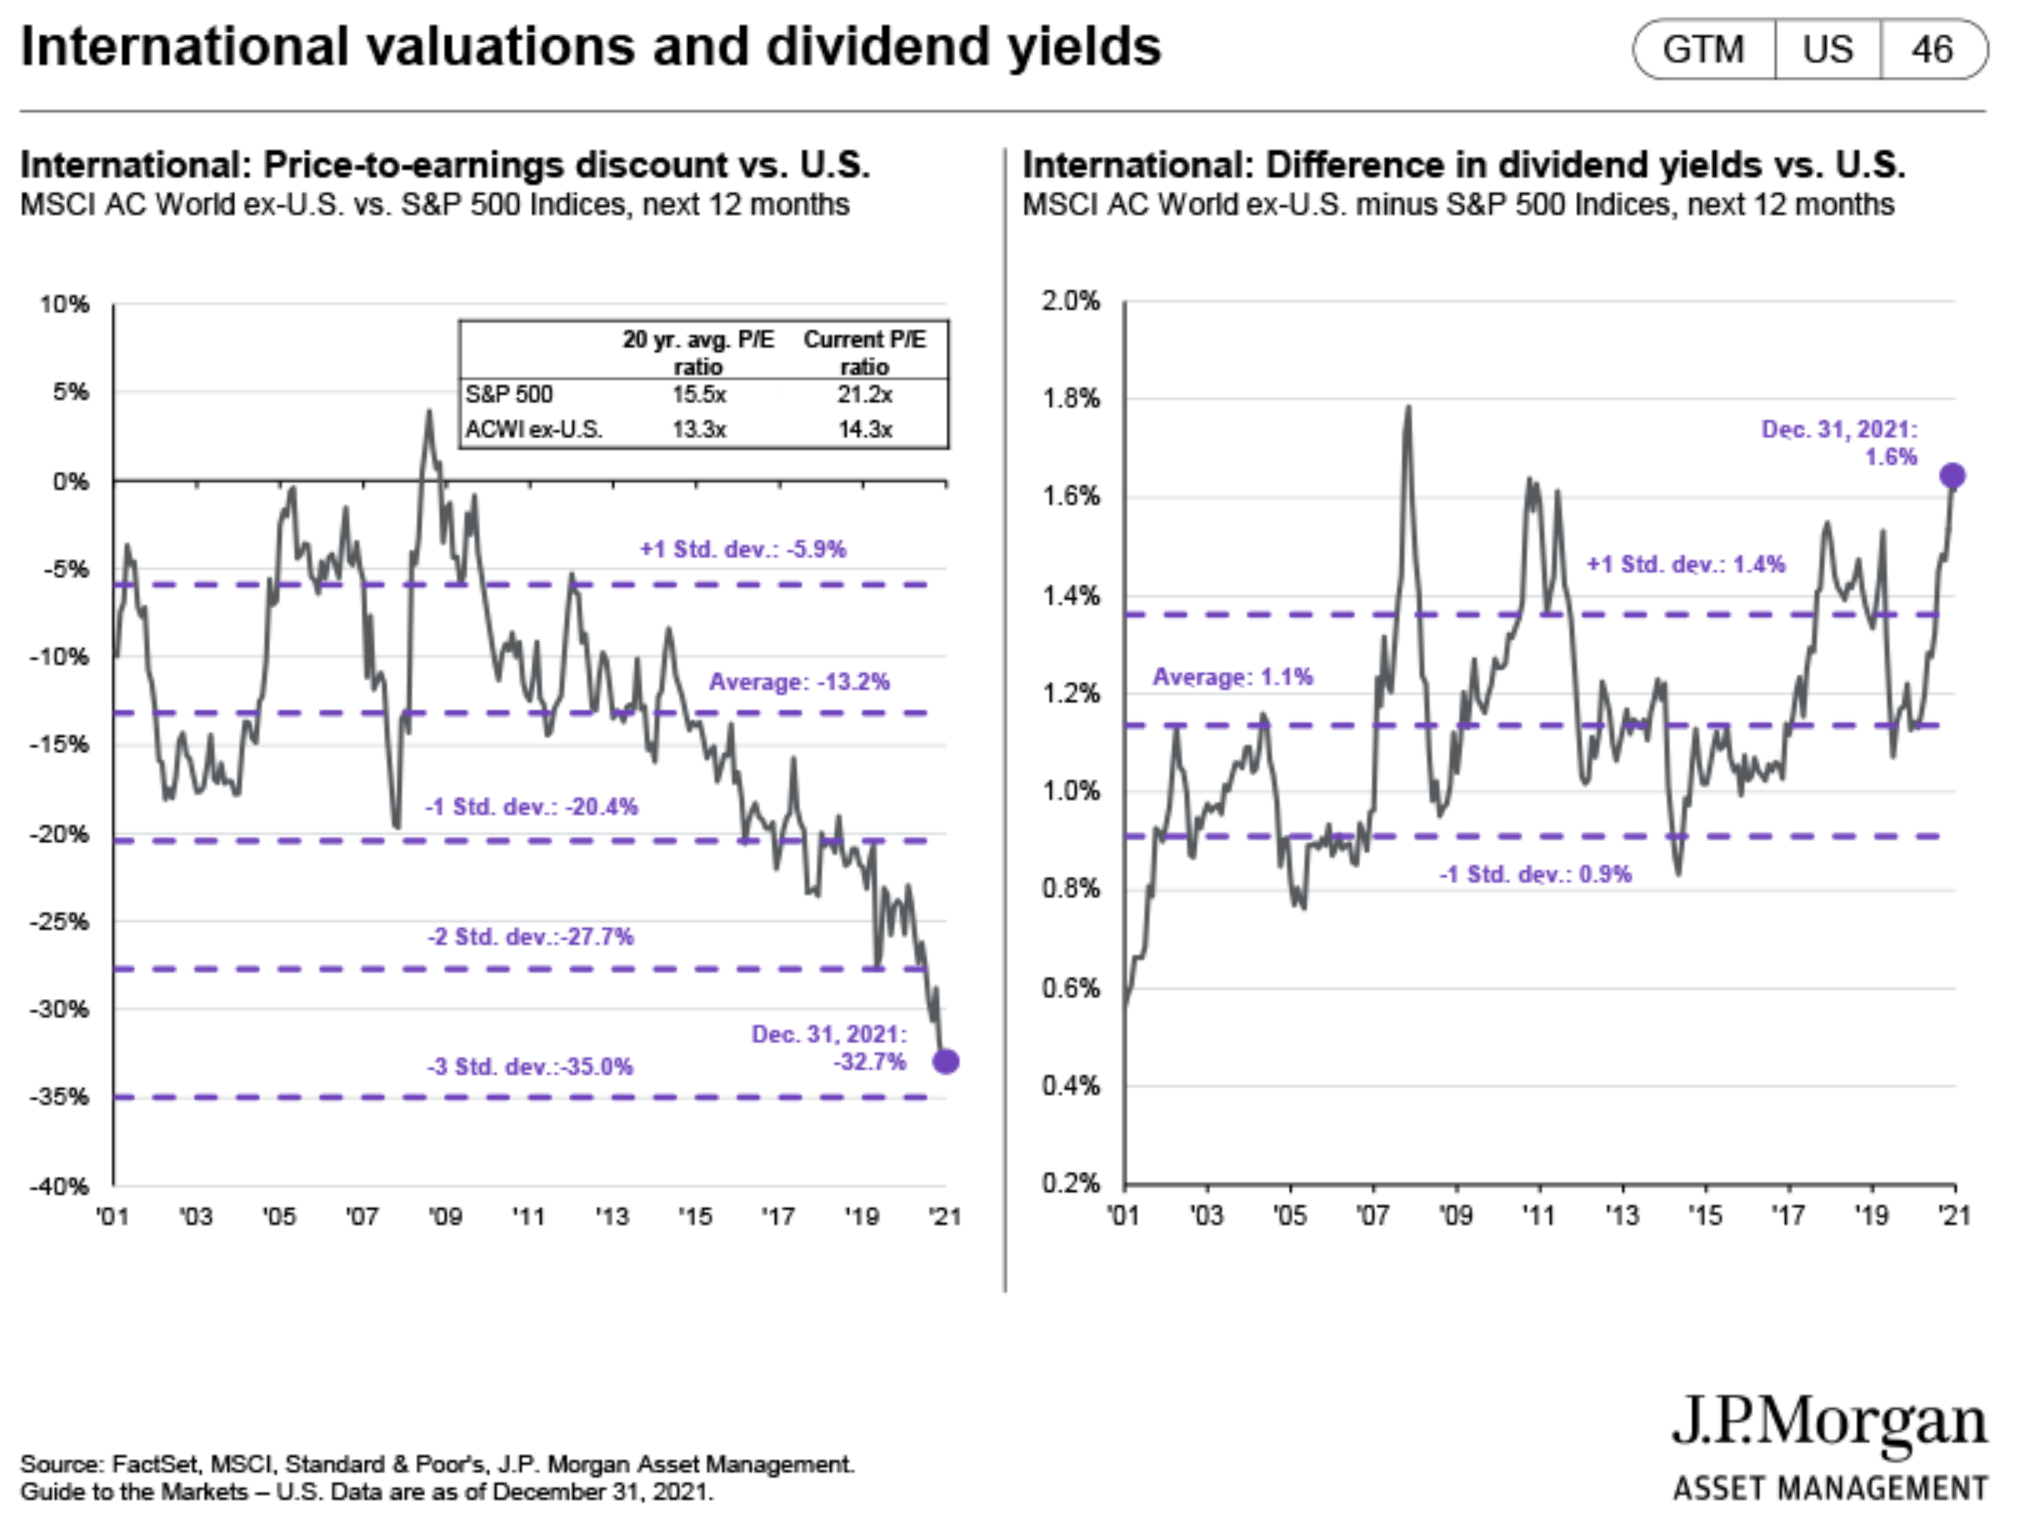
And so, if you look at the left-hand side of this chart first, this is showing that discount, on average, this goes back about 20 years. And on average, international stocks do trade at a discount to U.S. stocks. That average discount and when you look at this chart is about 13.2%. Right now, that discount is reaching nearly 33%. That is almost a 3 standard deviation event, which is a very extreme event. So once again, this long-term period of sustained underperformance of international regions has created a huge valuation discrepancy when you look at those two markets. That’s also showing up on dividend yield as well. So, the right-hand side of this chart plots out the difference in dividend yield of the U.S. versus international stocks. And once again, going back 20 years, and you can see we’re hitting high levels on here.
So, one way to play this, if you want to take advantage of the valuation discount, along with the dividend yields in international markets, you can look at the S&P International ETF (NYSE: DWX). So once again, there’s still a lot of signs the markets overall are overvalued, despite the cuts that we’ve seen in the growth space are still, broadly speaking, excessive evaluations. You can find bargains, but if you’re more of a passive investor, if you’re looking at ETFs overall, there could still be some challenges with those segments of the market. And so that’s why I highlight areas that have seen these really long-term sustained trends of underperformance, but that’s creating some great opportunities, especially when you start to look at relative valuations as well. And that’s why we’re here focusing once again on the big picture, here at The Bauman Letter.
That is all I have for you today. This is Clint Lee. Thanks for watching.
Good investing,

Angela Jirau
Publisher, The Bauman Letter