
Our gut reaction tells us to buy stocks after they get crushed. We “buy when there’s blood in the streets.”
But Warren Buffett, the most famous investor of our time, apparently doesn’t think that time is now. He admitted his company sold all of its airline stocks as they plunged in February. Buffett doesn’t think there’s blood in the streets yet — he thinks it’s going to get worse.
I agree. Things are likely going to get worse, especially for the airline industry. Buffett will make bold moves when he thinks we’ve seen an extreme sell-off. Until then, we’ll follow his lead and expect more declines to come.
Boeing (NYSE: BA), an airline manufacturing juggernaut, has struggled for years. You’ve seen the headlines — regulatory fraud, a CEO fired and two high-profile plane crashes. That’s even before the economic shutdown.
Shares have fallen 70% from their all-time high. Now many investors think it’s the time to buy.
But the price pattern for the stock is calling for more pain ahead.
Today, I’ll explain how you can use options to take advantage of the price action in the coming weeks…
Three Reasons We Like What We’re Seeing
With Boeing’s share price stuck in a descending triangle, we have an opportunity today to make a bearish trade on the stock:
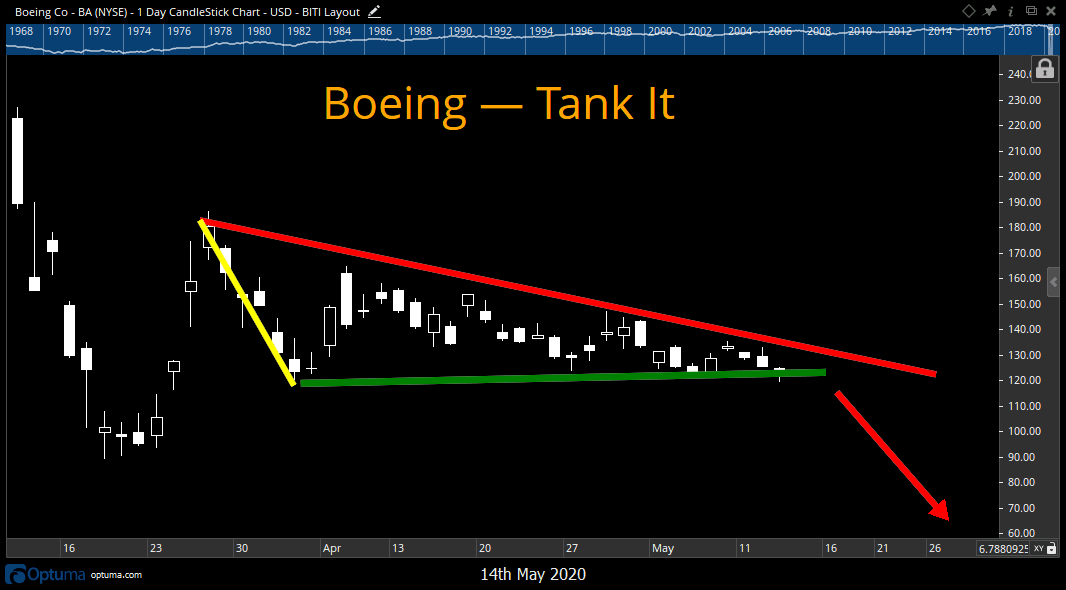
(You can click on the image to enlarge it.)
The descending triangle pattern is made up of the horizontal support line (in green) and a declining resistance level (in red). The support line is the level the stock seems to have trouble dropping below and the resistance level is the price the stock is having trouble breaking above. It forms a triangle, with a spike near the beginning of the chart (in yellow), helping to create the actual triangle. Patterns like this usually come before a downturn.
Now, there are a few things I love about triangle patterns.
The first is the clear trend lines. We have easy-to-spot support and resistance levels. When the stock closes outside those lines, the trend is in full swing and it’s time to close any trades that are not in that new direction.
The second thing a triangle pattern tells us is how big of a move to expect.
You simply look at the height of the pattern on the price chart — the yellow line. In this case, you look at the high of $180 and the low of $120. A difference of $60. Then you subtract it or add it (depending on the direction of the breakout) to the point where the breakout occurs. So, if the breakout is to the downside like I expect, we are looking at a target price of $60 per share in the coming months.
The last thing to note about triangle patterns is that the breakout tends to be in the same direction the stock was already trending in. In other words, it’s a continuation pattern.
Since we already know shares are down more than 70% from their recent peak, the trend is clearly to the downside.
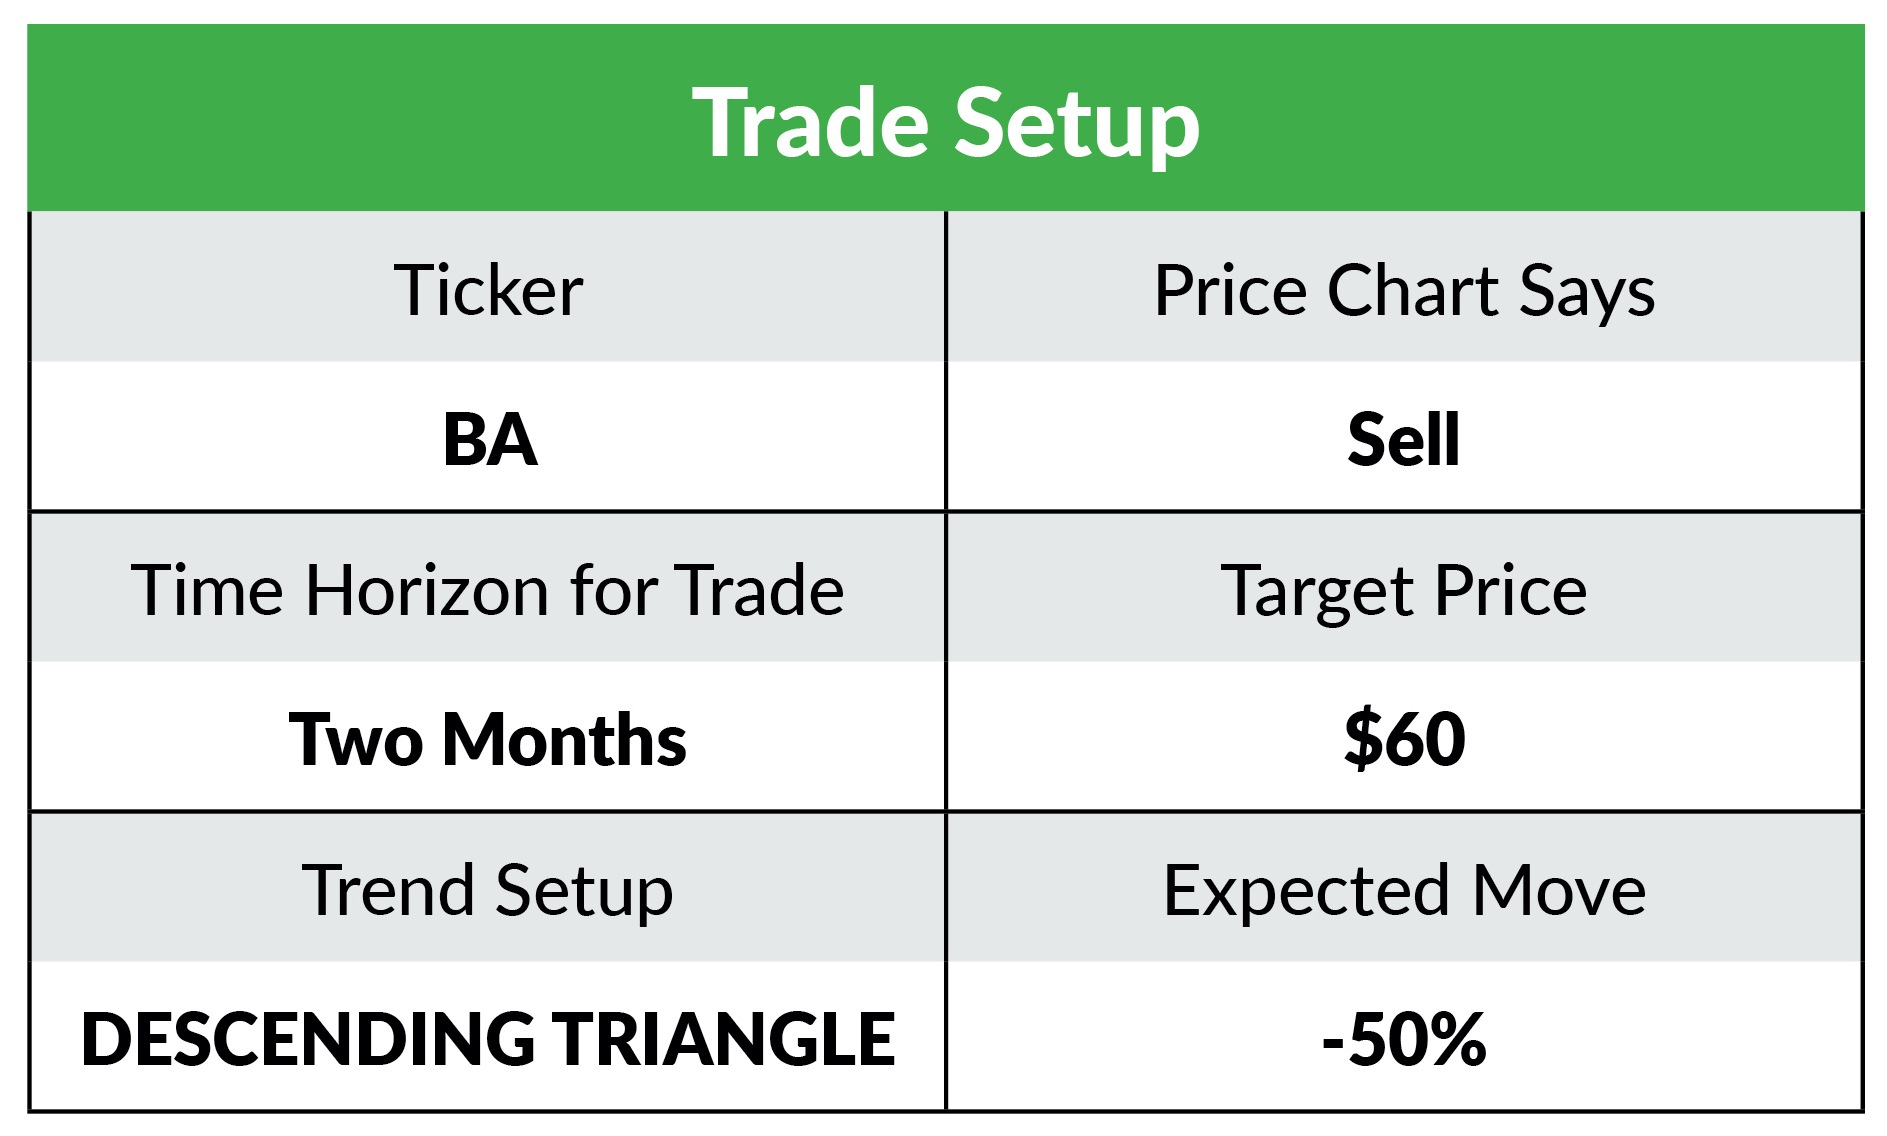
When we put all these pieces together, we can expect shares to head lower. That gives us an initial price target of $60 share, or a 50% drop from current prices. So we have our clear trading patterns showing us what to expect. Here’s how the trade setup looks for Boeing.
Your Trade Setup
The best way to profit from a stock’s directional move is with options.
It’s why we have designated Friday as our free Bonus Options day. To make sure everyone has an opportunity to make big profits as stocks make the next big move.
If you are looking for more options trade recommendations, check out my Quick Hit Profits research service. We have averaged a 100% winner every month for three years running by following a proven system. My colleague Matt Badiali put together a special presentation to tell you all about it. Click here to watch now.
It took about two months for the current triangle pattern to form, so I’ll give the trend about two months to make the full move down to $60 a share. That means we want to pick an expiration date that covers this time frame. We’ll look at August 21, 2020.
The stock is currently trading around $120 a share. We want to pick a strike price that is a close as possible, so we’ll use $120.
That put option is listed as trading at $18.75 per share. Since one option contract covers 100 shares, that means it would cost you $1,875 for one contract.
Based on our purchase price and strike price, if the stock falls to $80, we will have doubled our money. If it falls further before our option expires, we’ll see even bigger gains.
Since this is a bonus opportunity, we won’t be updating you on what action to take next. Instead, we’ll layout some guidelines today to help you manage the trade…
I like to set limit orders to sell half of my trade if it hits a 50% gain. For example, if you buy two put options for $18.75, you can place a limit order to sell one at $28.13.
To help limit your downside risk, you can plan to exit the trade if the stock closes above $140 or if your loss hits 50%.
Here’s the table with the trade setup:
That’s all for today.
Reach out to us at winninginvestor@banyanhill.com with your questions or feedback!
Regards,

Chad Shoop, CMT
Editor, Quick Hit Profits
P.S. On Monday, I recorded a new YouTube video detailing this trade on Boeing. While it’s up 40% already, there’s room for much larger gains. You can still check out that video to see how I break down the price chart and talk about selecting the perfect option.