When it comes to investing, you should have one goal in mind — to make money.
But if you are using a strategy, you should also have another goal. That is to outperform the S&P 500 Index.
Think about it: If you are utilizing a strategy that either incurs trading fees, a subscription cost or advisory fees, it costs you money to implement it.
Since that’s the case, you don’t want to just make money. You don’t even want to outperform some random benchmark a broker may show you that compares to your strategy.
You want to outperform the S&P 500.
After all, you can easily buy an index on the S&P 500 with minimal fees.
Well, there’s one strategy that has outperformed the S&P 500 based on average annualized returns over the last three decades.
Let’s start with a chart…
A Win-Win Strategy

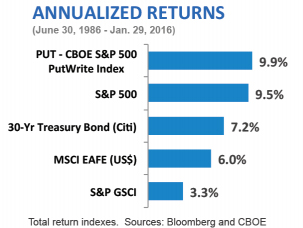
Here are the annualized returns for four major asset classes.
The S&P 500 is 500 of the largest stocks in the U.S.
A 30-year Treasury bond is for the U.S. as well.
The MSCI EAFE stands for developed markets outside of the U.S. such as Europe, Australia, Asia and the Far East.
S&P GSCI covers commodities.
But at the top of the chart is likely something you may have never heard of: the CBOE S&P 500 PutWrite Index (PUT).
Now, if you don’t know what it means to sell put options, I’ll give you a very brief explanation.
Basically, you sell a put option to get paid for possibly buying shares of a stock. And you get to pick the price that you pay for the stock.
So, on the day you make the trade, which lasts for a specified time period, you can pick a price that is below where the stock is currently trading.
The Best of Both Worlds
You may look at this chart and think a 0.4% outperformance for PUT over the S&P 500 isn’t a big deal.
Keep in mind, PUT simply sells puts, also known as writing puts, on the S&P 500 itself.
So, there’s a powerful statement in this chart: When comparing the ownership of an individual stock versus selling puts on that same stock, selling puts generates a better return.
That’s a remarkable phenomenon.
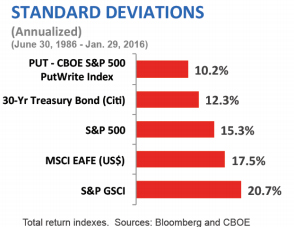
But what is more important to me, and should be to you too, is that the standard deviation —think the volatility in your returns — is a third less than the S&P 500.

This is the best of both worlds.
Beat the S&P 500 With Put Options
Many strategies can claim to beat the S&P 500. But even over a short period of less than five years, their standard deviations tend to be at least double that of the S&P 500.
That’s an extremely volatile return.
And if you are taking that kind of risk, hopefully you are doing much, much better than the S&P 500’s return.
If not, you’re taking too much risk for the reward.
Put options are the ideal scenario.
Not only are you set to outperform the underlying index, but you’re also doing it while minimizing your portfolio’s volatility.
That’s why I utilize this concept in our most consistent trading service, Pure Income.
Regards,

Chad Shoop, CMT
Editor, Automatic Profits Alert


