The terms “bull market” and “bear market” get thrown around too easily.
The normal definition for bear market is when the market is down 20% from its high point. But sometimes, that’s just a blip in the radar.
For example, the S&P 500 fell 20.5% on October 19, 1987. It became more ominously known as “Black Monday.”
In the grand scheme of things, it’s noticeable, but it was just a dip in a 20-year rally where the market went up over 1,200%.
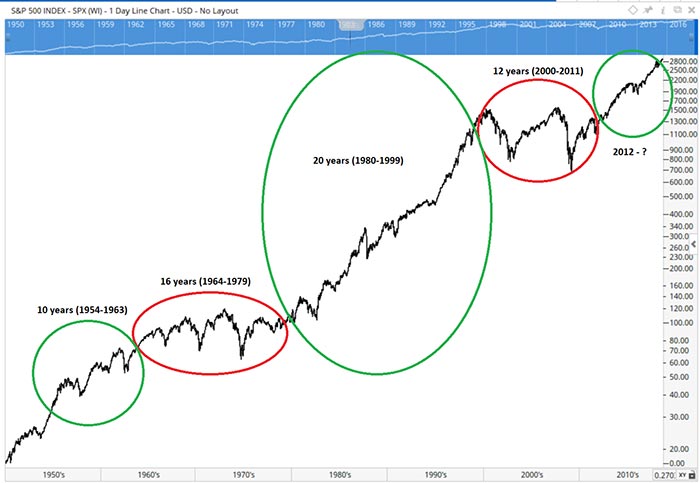
Across history, the market has two main modes: up and flat. The past five big cycles are pointed out in the chart below.

Prior to that amazing 20-year rally, the market went nowhere overall from the 1929 crash through 1953. In fact, the market looked similar to the flat markets of 1964 to 1979 and 2000 to 2011.
Of course, a lot of money was lost and made during these times. But, if you had ridden it out, you would have been even. And if you kept putting money in during the worst times, you’d have likely made a profit.
This Isn’t the End
Everywhere you look, someone is calling for the next crash. But this “up” phase didn’t even start until 2012.
People like to cite the “10-year bull market” cycle as a reason to get out of the market. But in my opinion, this current rally is still in the early stages.
Unemployment, consumer spending, gross domestic product growth and homebuilding activity are just some of the indicators that are in very good shape. We’ve also seen companies reporting very high sales and profits growth the past few years.
Of course, that’s not saying a short-term “bear market” is out of the question.
Will it happen in a day like 1987? Probably not.
This past February, we saw the market fall 10%, and it turned out to be a great buying opportunity. Now, we’re back at all-time highs. It’s year seven of this up-market, and if our economy keeps moving the way it is, I believe it could be another 10 or more years until the next flat one.
Regard,

Ian Dyer
Editor, Rapid Profits Trader


