There’s a popular idea that it’s best to own stocks when they’re going up. That idea makes sense. And academic research proves that’s the best strategy.
In academic research, “going up” is called momentum. This research assumes you buy the 10% of stocks that performed best over the past six months. Repeat this process every six months. That produces market-beating results.
There are problems with that strategy. It requires millions of dollars in capital to own shares of hundreds of stocks. Another problem is momentum stocks lose more than average in bear markets.
In the long run, measured in decades, momentum strategies defined in the academic literature work. But, because of the problems, those strategies aren’t practical for individual investors.
Because the returns of momentum are appealing, I looked at ways to overcome the problems with the strategies. The result is an indicator I call Peak Velocity.
Peak Velocity Makes Momentum Tradable
This indicator relies solely on price action. That’s because price action tells traders everything they need to know about stocks. It tells us whether prices are going up or down.
Stocks go up for just one reason: When prices are rising, it means buyers have a stronger opinion about the company than sellers do.
That means prices fall for just one reason: Declines occur when sellers act with more urgency than buyers.
Of course, there are reasons behind the actions of buyers and sellers. Maybe it’s an earnings report or the release of a new product. On the downside, maybe it’s a new product from a competitor, or a safety recall.
Each buyer and seller acts on their own analysis. But no one really knows what motivates most investors. So, Peak Velocity ignores the motivations. It quantifies the urgency of buyers and sellers.
The indicator times buy and sell signals in individual stocks. It can also provide insight into the strength of the broad stock market.
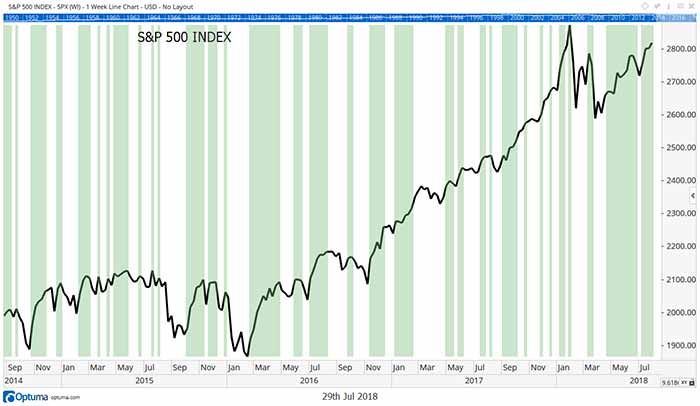
The chart below shows Peak Velocity applied to the broad stock market. Green bars mark times when the S&P 500 Index experienced Peak Velocity.

This indicator offered sell signals on even slight dips in the index. It moved quickly back to a buy signal for each rally.
Market-Beating Results
Testing confirms the signals beat the market. The test covered the last 10 years. The S&P 500 gained 11.5% annually over that time.
The test simulated trading the SPDR S&P 500 ETF (NYSE: SPY). It held that exchange-traded fund (ETF) when buy signals triggered, and moved to cash on sell signals. Those rules provided an average annual return of 22.8%.
That’s almost twice the gains of the S&P 500. And these results include deductions for commissions and trading costs.
More important, Peak Velocity decreased risk. Over the past 10 years, the maximum drawdown with Peak Velocity was 2.8%. Maximum drawdown is a measure of risk. It’s the largest loss in an account over a period of time.
The test period goes back to July 2008. That includes part of the bear market that began that year. The maximum drawdown in the S&P 500 over that time was more than 45%. Peak Velocity missed that loss because it was on a sell signal for most of the bear market.
History says this indicator will say to sell before the next bear market. I’ll be watching for that.
Regards,

Michael Carr, CMT
Editor, Peak Velocity Trader


